Sauron Self-Alerting
Sauron self-alerting provides pre-built alerts for the health and usage patterns of a Sauron instance. These alerts are defined in Grafana and routed to Sauron contacts or owners through Alertmanager.
A Sauron instance is created with self-alerting enabled. You can use the Sauron API Server to enable or disable the feature, list available self-alerts, change alert-specific settings, and configure custom self-alert email recipients.
What can I change?
| Task | API area |
|---|---|
| Enable or disable all self-alerting | /v1/selfalerting/actions |
| Check self-alerting status | /v1/selfalerting/status |
| Add custom self-alert email recipients | /v1/selfalerting/toEmails |
| List available self-alerts | /v1/selfalerting/alerts |
| Enable or disable one self-alert | /v1/selfalerting/alerts/{alertName}/actions |
| View or update one self-alert's configuration | /v1/selfalerting/alerts/{alertName} |
| Control whether future self-alerts are enabled by default | /v1/selfalerting |
Do not share passwords, tokens, SMTP credentials, webhook credentials, private keys, or full Alertmanager receiver secrets in support channels.
Enable or disable self-alerting
Check the current self-alerting status:
curl --fail --show-error -u sauron:mypassword \
  'https://api.stage.apatil.developers.oracledx.com/v1/selfalerting/status'
Enable self-alerting:
curl --fail --show-error -i -XPUT -u sauron:mypassword \
  'https://api.stage.apatil.developers.oracledx.com/v1/selfalerting/actions?action=enable'
Disable self-alerting:
curl --fail --show-error -i -XPUT -u sauron:mypassword \
  'https://api.stage.apatil.developers.oracledx.com/v1/selfalerting/actions?action=disable'
Add custom email recipients
Self-alerting can use custom email recipients. If toEmails is not provided, the contact email is used.
Add one email recipient:
curl --fail --show-error -i -XPUT -u sauron:mypassword \
  'https://api.stage.apatil.developers.oracledx.com/v1/selfalerting/toEmails?emails=abc@example.com'
Add multiple email recipients:
curl --fail --show-error -i -XPUT -u sauron:mypassword \
  'https://api.stage.apatil.developers.oracledx.com/v1/selfalerting/toEmails?emails=abc@example.com,xyz@example.com'
Manage individual self-alerts
List available self-alerts:
curl --fail --show-error -u sauron:mypassword \
  'https://api.stage.apatil.developers.oracledx.com/v1/selfalerting/alerts'
Example response:
[
  {
    "description": "Alert on the Prometheus head series dropping greatly",
    "name": "prometheusseriesdropping"
  }
]
Disable one self-alert:
curl --fail --show-error -i -XPUT -u sauron:mypassword \
  'https://api.stage.apatil.developers.oracledx.com/v1/selfalerting/alerts/prometheusseriesdropping/actions?action=disable'
Enable one self-alert:
curl --fail --show-error -i -XPUT -u sauron:mypassword \
  'https://api.stage.apatil.developers.oracledx.com/v1/selfalerting/alerts/prometheusseriesdropping/actions?action=enable'
Check one self-alert's enabled status:
curl --fail --show-error -u sauron:mypassword \
  'https://api.stage.apatil.developers.oracledx.com/v1/selfalerting/alerts/prometheusseriesdropping/status'
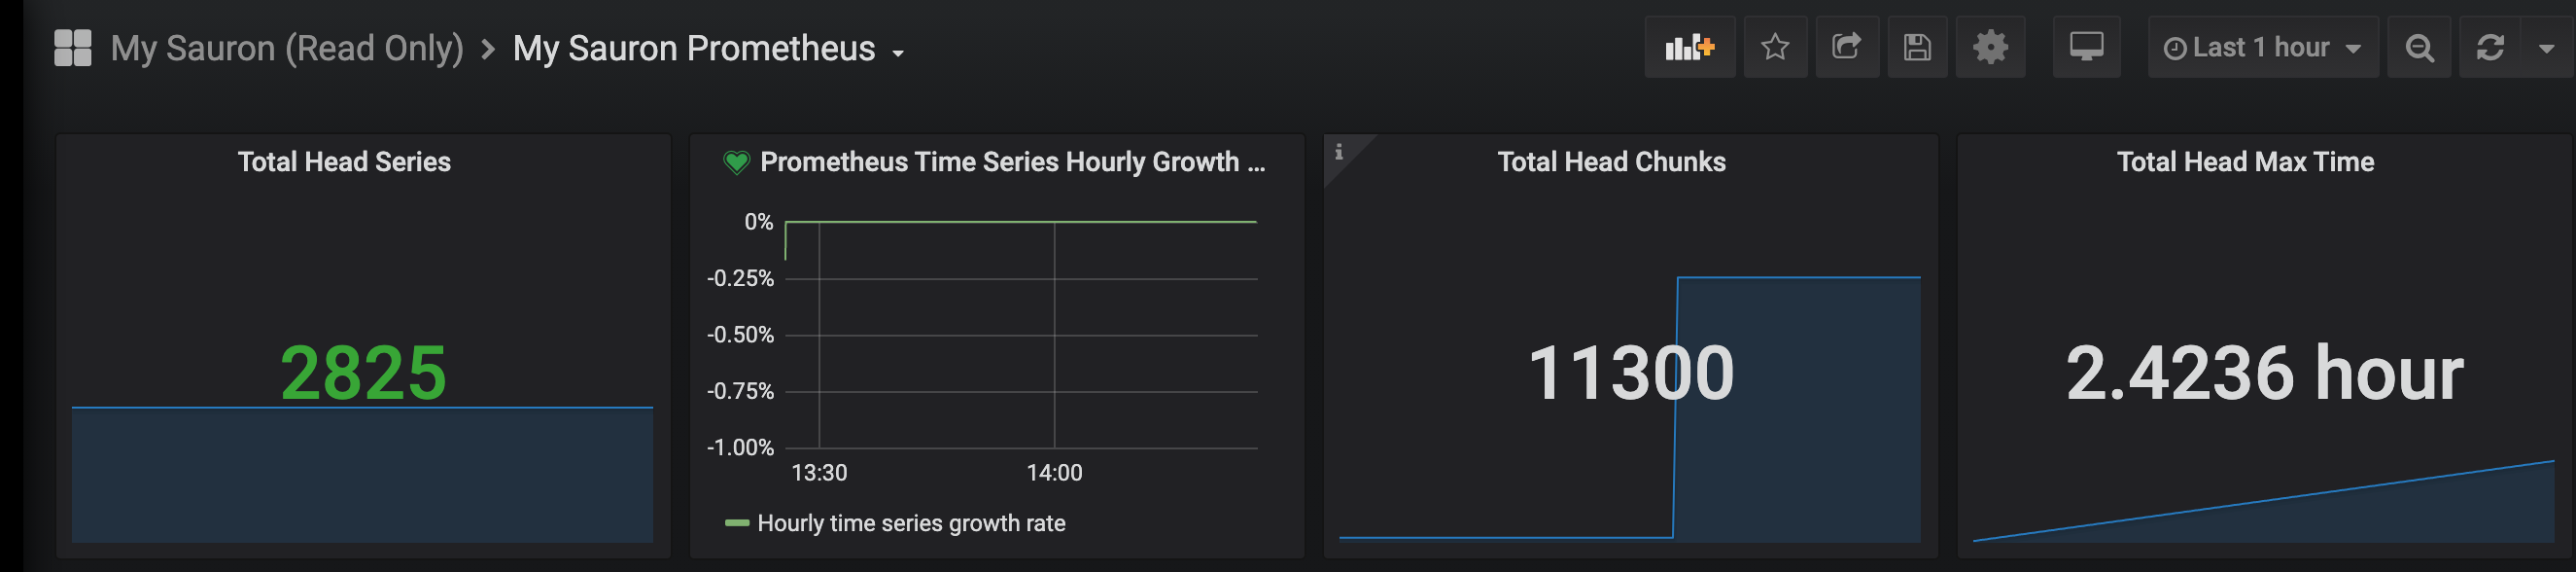
Once an alert is enabled, it appears in Grafana within a minute or two. For example, the prometheusseriesdropping alert appears on the My Prometheus dashboard. An active alert on a panel is indicated by a heart to the left of the panel name.
Update an individual self-alert
Some self-alert parameters can be modified:
severity: an arbitrary string that you can set based on your Alertmanager configuration.forMinutes: how many minutes the condition must fail before the alert fires.threshold: the threshold value for the alert condition.
Fetch the current configuration for an alert:
curl --fail --show-error -u sauron:mypassword \
  'https://api.stage.apatil.developers.oracledx.com/v1/selfalerting/alerts/prometheusseriesdropping'
Example response:
{
  "forMinutes": 15,
  "severity": "warning",
  "threshold": "-80"
}
Update the threshold for the same alert:
curl --fail --show-error -i -XPUT -u sauron:mypassword \
  -H 'Content-Type: application/json' \
  --data '{"severity":"warning","forMinutes":15,"threshold":"-50.0"}' \
  'https://api.stage.apatil.developers.oracledx.com/v1/selfalerting/alerts/prometheusseriesdropping'
Prove it works before production
After changing self-alerting:
- Confirm the API request returns a successful status.
- Confirm
/v1/selfalerting/statusor the alert-specific status endpoint shows the expected state. - Open the related Grafana My Sauron dashboard and confirm the alert appears when enabled.
- Confirm Alertmanager has a route and receiver for the alert.
- If notification delivery is expected, verify the receiver receives a test or real notification.
- If delivery fails, check Alertmanager logs and receiver errors with secrets removed.
Future self-alert defaults
New self-alerts appear through /v1/selfalerting/alerts. By default, future self-alerts are enabled when they become available. To disable future self-alerts by default:
curl --fail --show-error -i -XPUT -u sauron:mypassword \
  -H 'Content-Type: application/json' \
  --data '{"enableNewAlerts":false}' \
  'https://api.stage.apatil.developers.oracledx.com/v1/selfalerting'
View the current future-alert setting:
curl --fail --show-error -u sauron:mypassword \
  'https://api.stage.apatil.developers.oracledx.com/v1/selfalerting'
Alertmanager routing reference
Sauron self-alerts are routed through Alertmanager. Grafana is configured out of the box with a notification channel for Alertmanager, and that notification channel is used by Sauron self-alerts.
If you already have an Alertmanager route and receiver configured, self-alerts enter that existing receiver stream. To route self-alerts separately from ordinary alerts, use the mysauron label.
For complete receiver examples, see:
- Ocean integration for metrics alerts
- Slack integration for Alertmanager alerts
- Email integration for Alertmanager alerts
This example shows the routing shape for sending alerts with the mysauron label to a separate receiver:
route:
  receiver: Service-Production
  group_by: ['alertname']
  group_wait: 30s
  group_interval: 1m
  repeat_interval: 3m
  routes:
    - receiver: Slack-Receiver
      group_by: ['alertname']
      match_re:
        mysauron: .+
receivers:
  - name: Service-Production
    webhook_configs:
      - url: replace-with-service-webhook-url
  - name: Slack-Receiver
    slack_configs:
      - api_url: replace-with-slack-webhook-url
        icon_url: https://alertmanager.stage.apatil.developers.oracledx.com
        send_resolved: true
If you set custom self-alert severity values, make sure your Alertmanager routes and receivers treat those values the way you expect.
Prometheus self-alert reference
Prometheus Disk Usage High
Default Prometheus storage is 500 GB per instance. Sauron provides highly available Prometheus as a service, which requires two instances. This alert is triggered when Prometheus disk usage reaches more than 90% in the last 15 minutes.
Customer checks:
- Review your Prometheus configuration. If you are scraping aggressively, consider increasing the scrape interval.
- Check for high-cardinality metrics. Open the Prometheus status page, look for the highest-cardinality labels, and drop labels that have higher than 1,000 cardinalities.
- Consider shortening the retention period if possible. Sauron-team action is required to change the retention period.
If those checks do not resolve the issue, contact Sauron support.
My Sauron - Time Series Dropping
This alert fires when Prometheus TSDB head series has dropped by 80% in the last 1 hour. This can indicate a customer-side scrape, push, or configuration issue.
Customer checks:
- Recheck scrape configuration.
- Recheck server configuration.
- Recheck connectivity to Prometheus, PushProx, or Shuttleproxy servers.
OpenSearch self-alert reference
OpenSearch Disk Usage High
The default threshold is 70%. After it crosses 75%, the Sauron team gets the alert.
Customer checks:
- Check whether
DEBUGmode is enabled in any application. If it is enabled, disable it. - Check for indices named without a timestamp or with a timestamp outside the supported patterns:
-%{+yyyy.MM.dd}-%{+yyyy-MM-dd}-%{+yyyy_MM_dd}- Fix log shipper client settings to use one of the supported index patterns.
- Optimize data sent to OpenSearch. Elastic documents tuning for disk usage.
- If you are sending logs or metrics from different regions to a single Sauron endpoint, request new Sauron instances in the specific regions.
- Consider shortening the retention period if possible. Sauron-team action is required to change the retention period.
- If ingestion has grown because of more clients, ask Sauron support about increasing OpenSearch disk size.
OpenSearch Shard Size Too Large
This alert fires when some OpenSearch shards have reached 50 GB and need to be lowered to 30 GB.
Customer checks:
- Consider increasing the shard count of the indices.
- Filter unnecessary messages from the client side.
- Split one large index into several smaller indices.
Alertmanager self-alert reference
Alertmanager Notification Failed
Alertmanager tried to send an alert notification through a customer-configured receiver, but the attempt failed and the notification was not sent.
Check Alertmanager logs through the Sauron API Server and look for the receiver error. Common failure modes include:
- SMTP authentication failed.
- OCEAN authentication failed.
- Slack authentication failed.
- Slack channel not found.
- Slack channel archived.
- Unable to reach Slack.
For credential-related errors, update the Alertmanager configuration with valid credentials. For Slack channel errors, update the receiver to use a valid channel. For unreachable Slack errors, check the Slack URL and make sure no proxy_url was supplied in the Alertmanager configuration.
OCEAN Token Expiring
An OCEAN token in the customer-supplied Alertmanager configuration has expired or will expire soon.
Customer action:
- Get a new OCEAN token.
- Use the Sauron API to update the Alertmanager configuration with the new token.
- See the OCEAN External Webhook Onboarding Guide for information about how to get a new token.
Self-check before escalation
Before contacting Sauron support, collect this information:
- Sauron URL.
- Self-alert name, if the issue affects one alert.
- API path used.
- Auth method used for the API call.
- Exact API status code and response message.
- Current self-alerting status.
- Current alert-specific status or configuration.
- Grafana dashboard or panel where the alert should appear.
- Alertmanager route and receiver name.
- Exact delivery error, with credentials removed.
- Recent self-alert, Alertmanager, receiver, metric, log, or retention changes.
- Impact, including whether this affects one alert, all self-alerts, or notification delivery only.
Do not share passwords, tokens, SMTP credentials, webhook credentials, private keys, or full receiver secrets in support channels.