Defining Alerts
An alert rule tells Prometheus when a condition needs attention. Alertmanager uses a route (delivery rule) to send a firing alert to a receiver (notification destination). Start with Sauron's tool guide if these names are new.
Follow an existing metric alert
You can check an alert without changing its configuration. Get the alert name and intended recipient from your service owner first.
- Open Prometheus Alerts and find the alert. It must be Firing to check notification delivery.
- Open Alertmanager and find the same alert.
- Confirm the intended recipient received the notification.
If the alert is missing from Alertmanager or no message arrives, ask your Sauron owner to check whether it was forwarded, muted, sent to the expected receiver, or failed delivery. If no alert is firing, use the approved test below; do not cause a service failure just to test delivery.
Create your first metric alert
The commands show this Sauron's API username; curl prompts for its password.
Basic alert rule test
For the first connection walkthrough,
wait until up{job="sauron-first-metric-test"} returns 1. The rule below
then fires while the scrape is healthy, without stopping your service. Ensure
the filename does not already exist on the test Sauron; if it does, choose a
unique name and use it for both upload and deletion.
cat > sauron-first-alert-test.rules <<'EOF'
groups:
  - name: sauron-first-alert-test
    rules:
      - alert: SauronHelpNotificationTest
        expr: up{job="sauron-first-metric-test"} == 1
        for: 1m
        labels:
          severity: info
          sauron_help_test: "true"
          job: sauron-first-metric-test
        annotations:
          summary: Sauron Help notification test
EOF
To test a different job, change its name in both expr and the job label.
If no metric exists yet, vector(1) can test a route without depending on a
scrape. In either case, confirm the route before uploading a rule that fires.
Upload the rule file to the test Sauron:
curl --fail --show-error -i -u 'sauron' \
  -T sauron-first-alert-test.rules \
  'https://api.stage.apatil.developers.oracledx.com/prometheus/rules/sauron-first-alert-test.rules'
After upload, check the whole path:
- Open Prometheus Alerts and confirm the rule appears.
- Wait for the rule to become Firing after its one-minute hold period and the next evaluation.
- Open Alertmanager and confirm Alertmanager routes it to the approved test receiver.
- Confirm the intended test recipient actually receives the notification.
Remove only this test rule when done:
curl --fail --show-error -i -X DELETE -u 'sauron' \
  'https://api.stage.apatil.developers.oracledx.com/prometheus/rules/sauron-first-alert-test.rules'
If it fires but no message arrives, follow the notification checks. An unconfigured receiver requires your Sauron owner; do not replace the shared Alertmanager config with a sample.
Scrape-failure rule
Once the test message arrives and you have deleted the temporary rule, ask the Sauron owner whether this job should notify the same team channel in production. If approved, create a new rule file:
cat > sauron-first-metric-down.rules <<'EOF'
groups:
  - name: sauron-first-metric-down
    rules:
      - alert: SauronMetricsEndpointUnreachable
        expr: up{job="sauron-first-metric-test"} == 0
        for: 5m
        labels:
          severity: warning
          job: sauron-first-metric-test
        annotations:
          summary: Sauron cannot scrape the configured metrics endpoint
EOF

curl --fail --show-error -i -u 'sauron' \
  -T sauron-first-metric-down.rules \
  'https://api.stage.apatil.developers.oracledx.com/prometheus/rules/sauron-first-metric-down.rules'
Confirm the new rule appears in Prometheus Alerts and is Inactive while the target is UP. It fires after the configured target's scrapes fail for five minutes, then uses the job's Alertmanager route. It does not detect every service failure or a job removed from Prometheus configuration. Test an actual failure only when the service owner has a safe test target and approves the exercise; the earlier test rule proves notification delivery without causing an outage.
Prove it works before production
For scrape reachability, use the scrape-failure rule. For an alert about service behavior, choose a service metric you can already query in Prometheus and agree on the condition and recipient with your service owner. Put that expression in a new rule file, test the condition safely in a test Sauron, and confirm both the firing rule and delivered message before production. An accepted upload alone is not a delivery test.
Metrics alert reference
Prometheus evaluates the rule; Alertmanager routes a firing alert. The Sauron API updates their files. Read and preserve the current configuration before changing a shared route. The sections below cover rule syntax and individual receivers; the first alert test is enough to learn the basic path.
Defining Metrics Alert Rules
Rules use YAML and do not specify where notifications go. Copy the shape of the first rule, replacing its test expression and labels with the condition and route agreed with your owners. Use a new filename, upload it with the first rule command, and check it in Prometheus Alerts. Do not replace another team's file. See the Prometheus rule format for more fields.
Defining Metrics Alert Routes
Alertmanager routes and receivers live in one shared configuration. See its configuration format.
This minimal configuration shows the shape of a route and receiver; it does not deliver a notification and must not replace a working configuration:
route:
  receiver: Test
receivers:
  - name: Test
To change a real route, fetch and preserve the current config through
GET /alertmanager/config, merge the approved receiver and route, and use
PUT /alertmanager/config. Verify the route and actual delivery afterward.
Defining Ocean Integration for Metrics Alerts
route:
  receiver: Testing
  group_by: ['...']
receivers:
  - name: Testing
    webhook_configs:
    - http_config:
        authorization:
          type: Bearer
          credentials_file: /etc/alertmanager/auxiliaryfiles/ocean-bearer-token
      url: https://oceanclient.ocs.oraclecloud.com/api/v1/webhooks/json/prometheus-alertmanager
Get the Ocean webhook bearer token using Ocean Help. Ask your Sauron owner to store it in the restricted auxiliary file named above; keep the token out of the shared Alertmanager configuration.
Defining Email Integration for Alertmanager Alerts
OCI Email Delivery approved senders are regional. Use the region and sender approved for your team, and get the SMTP endpoint from that region's Email Delivery configuration. You need access to the sending OCI tenancy. Ask your tenancy owner for access and an approved sender if you cannot create them yourself.
- In the sending region, generate an SMTP credential under your OCI user settings. Save the password in your approved secret store; OCI shows it only when created.
- In that region, create an approved sender in the intended compartment. Confirm the sender address with your email owner before updating Alertmanager.
Update Alertmanager configuration
1. Fetch and save the current configuration. Use GET /alertmanager/config.
2. Merge the route and receiver fragment. Replace the sender, recipient, SMTP host, and credential placeholders. Preserve existing routes and receivers.
route:
  routes:
    - receiver: "my_alert_receivers"
      matchers: ['severity="email-test"']
receivers:
  - name: "my_alert_receivers"
    email_configs:
      - from: 'approved-sender@example.com'
        to: 'first.last@oracle.com'
        smarthost: 'smtp-endpoint-for-your-region:587'
        auth_username: '<SMTP Username, e.g. ocid1.user.oc1.xxxxxxxxxx.com>'
        auth_password: '<SMTP Password, e.g. replace-with-smtp-password>'
        send_resolved: true
3. Submit and check. Submit the merged file with
PUT /alertmanager/config in the Sauron API, then check the route before
sending a test alert.
Use a test Sauron or an owner-approved test receiver before posting:
    curl --fail --show-error -i -u 'sauron' \
    -H 'Content-Type: application/json' \
    -d '[{"labels": {"alertname": "test-alert-1", "severity": "email-test"}}]' \
    https://alertmanager.stage.apatil.developers.oracledx.com/api/v2/alerts
Check the actual configured recipient's inbox and Alertmanager delivery status. A firing alert alone does not prove email delivery.
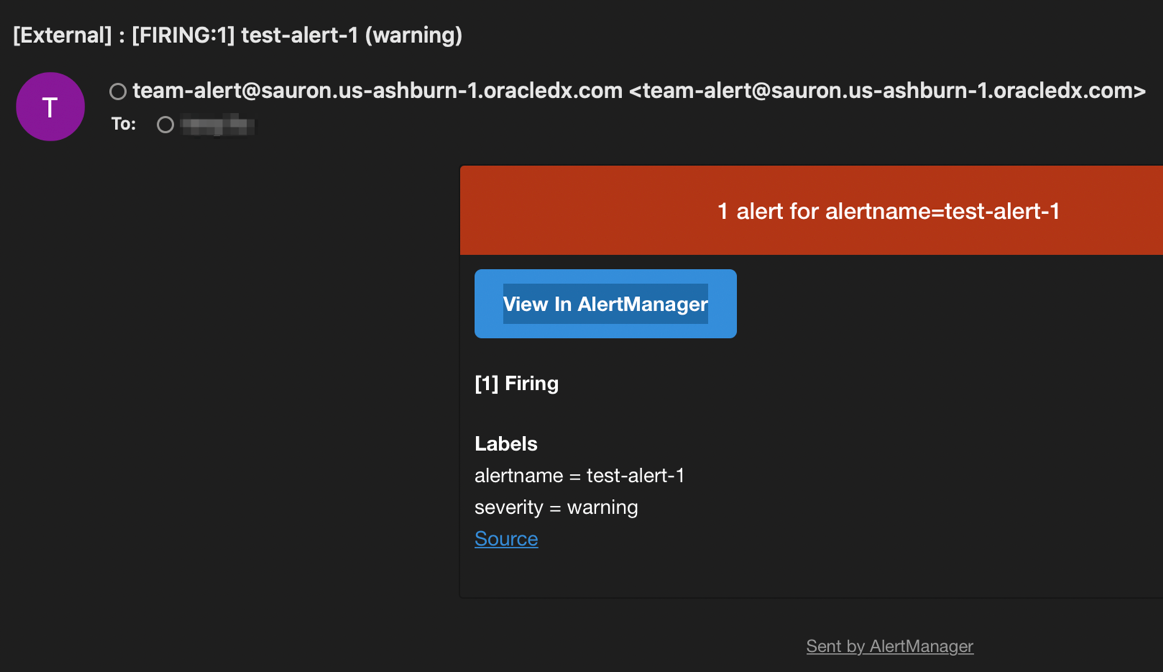
Optional Alertmanager email template
To customize the email body:
1. Edit the template. Open the template example
and keep its {{ define "email.key" }} and {{ end }} lines.
2. Upload it. Upload the file as email.tmpl through the
template API.
3. Reference it in Alertmanager. In the saved Alertmanager config, add this at the top level:
templates: ['/etc/alertmanager/templates/email.tmpl']
Then add this under the relevant email_configs entry:
html: '{{ template "email.key" . }}'
4. Verify the result. Send the test alert again and confirm the recipient sees the new body.
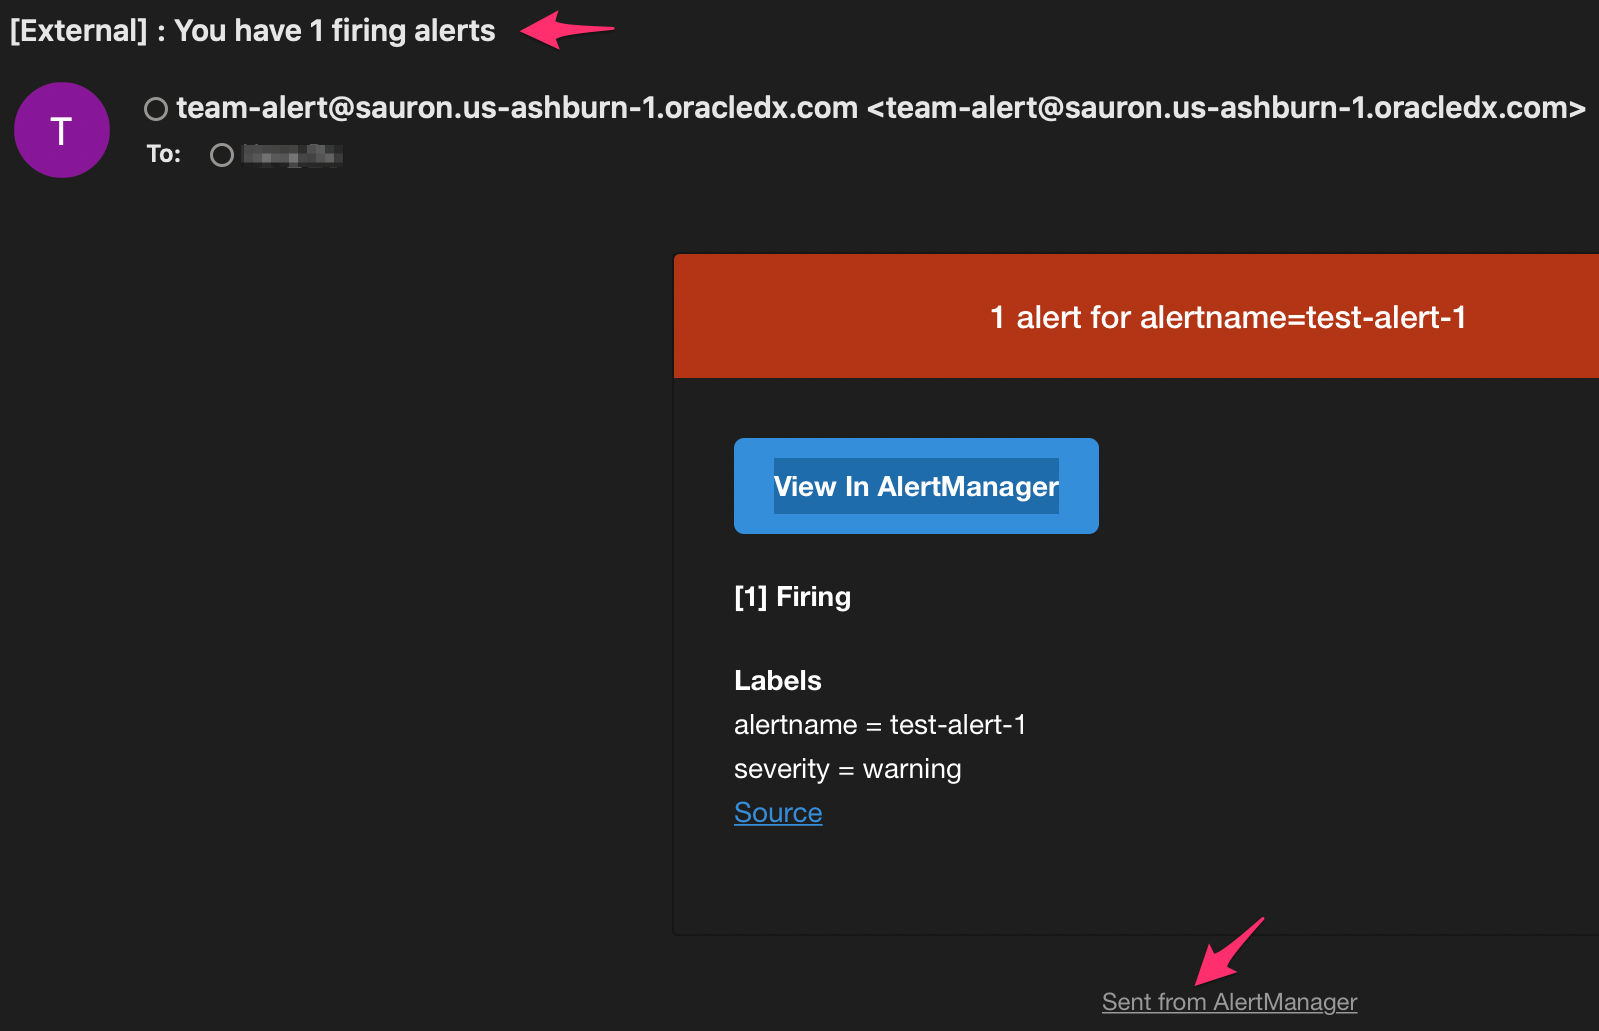
Defining Email Integration for Grafana Alerts
Grafana email needs an OCI SMTP credential and an approved sender in the same
region; follow the Email Delivery steps.
The Sauron team must also enable SMTP for Grafana. Request this in
#sauron-support with your Sauron URL and intended sender before continuing.
Configure Grafana SMTP
Open the Grafana SMTP API and set:
smtpFromto the approved sender.smtpHostto the regional SMTP host and port.smtpUserandsmtpPasswordto the OCI SMTP credential.
Execute the request. Grafana restarts to apply the settings.
Create a Grafana email notification channel
In current Grafana alerting, open Alerting → Contact points, add an email contact point with the approved recipient, and test it. Older Grafana versions use notification channels, as shown below. Confirm the recipient receives the message; use your installed version's notification setup if the menu differs.
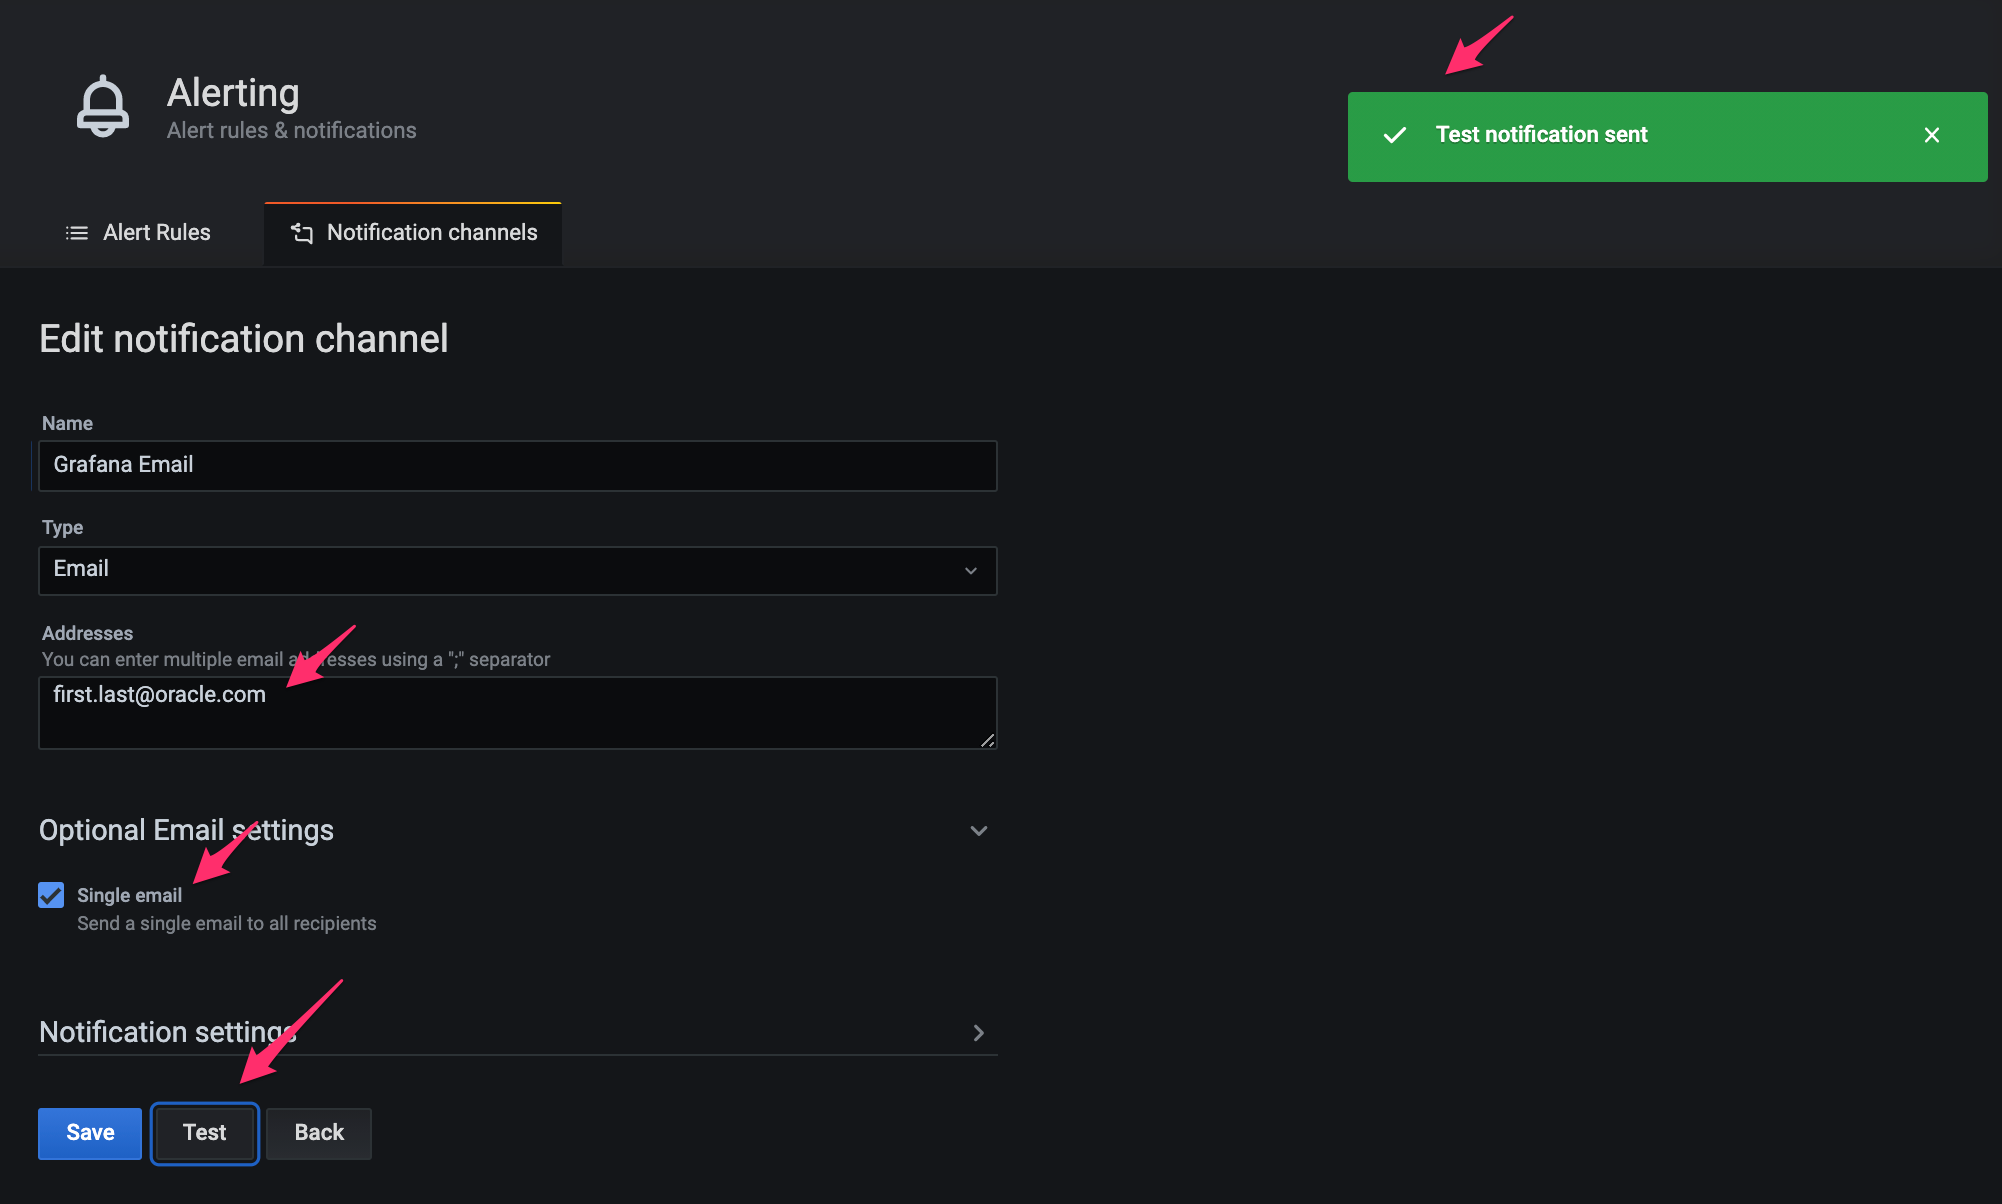
Optional: customize the Grafana email template
Read the current template, edit its body, and use the update API. Grafana restarts to apply the update. If needed, use the delete API to restore the default template.
Defining Slack Integration for Alertmanager Alerts
If your team needs a new Slack receiver, ask your Slack workspace owner for an
incoming webhook bound to an approved team alerts channel. Do not use an
unapproved channel. A Slack incoming webhook is tied to its channel; setting
channel in Alertmanager cannot redirect it.
Keep the webhook URL private: it is a credential. If you cannot change the
shared Alertmanager configuration, ask your Sauron owner to perform the steps
below with the approved webhook; do not send the webhook in Slack.
Open a Bash shell with bash for the commands below.
First, list existing auxiliary filenames and choose a new name if
sauron-first-slack.url already exists. Upload the approved webhook URL to an
Alertmanager auxiliary file without putting it in your shell history or a
checked-in file:
curl --fail --show-error -u 'sauron' \
  'https://api.stage.apatil.developers.oracledx.com/v1/alertmanager/auxiliaryfiles'

read -r -s -p 'Approved Slack webhook URL: ' SAURON_SLACK_WEBHOOK; echo
printf '%s' "$SAURON_SLACK_WEBHOOK" | \
  curl --fail --show-error -i -X PUT -u 'sauron' \
    --data-binary @- \
    'https://api.stage.apatil.developers.oracledx.com/v1/alertmanager/auxiliaryfiles/sauron-first-slack.url'
unset SAURON_SLACK_WEBHOOK
Fetch and preserve the current Alertmanager configuration in a private temporary file, then edit a copy. The file can contain other receiver secrets; keep it out of source control and support messages:
umask 077
ALERTMANAGER_BACKUP="$(mktemp /tmp/sauron-alertmanager.XXXXXX)"
curl --fail --show-error -u 'sauron' \
  -o "$ALERTMANAGER_BACKUP" \
  'https://api.stage.apatil.developers.oracledx.com/alertmanager/config' && \
  cp "$ALERTMANAGER_BACKUP" "${ALERTMANAGER_BACKUP}.edited"
Add this child route under the existing route.routes list, before any broader
route that would match the same alert. Add the receiver under the existing
receivers list. These are fragments, not a replacement for the complete
configuration; keep its existing root receiver and other routes:
route:
  routes:
    - receiver: sauron-first-metric-slack
      matchers: ['job="sauron-first-metric-test"']
receivers:
  - name: sauron-first-metric-slack
    slack_configs:
      - api_url_file: /etc/alertmanager/auxiliaryfiles/sauron-first-slack.url
        send_resolved: true
Review diff -u "$ALERTMANAGER_BACKUP" "${ALERTMANAGER_BACKUP}.edited" and
confirm only the intended route and receiver were added. If you cannot merge
the YAML safely, give the fragment and filenames to your Sauron owner for
review. Upload the edited file only after that review:
curl --fail --show-error -i -X PUT -u 'sauron' \
  --data-binary @"${ALERTMANAGER_BACKUP}.edited" \
  'https://api.stage.apatil.developers.oracledx.com/alertmanager/config'
Fetch /alertmanager/config again and confirm the new route and receiver
appear without changing the older ones. Then run the temporary first alert
test and confirm the message appears in the webhook's
channel. After verification, remove the private local copies with
rm -f "$ALERTMANAGER_BACKUP" "${ALERTMANAGER_BACKUP}.edited". If Alertmanager
rejects api_url_file, stop and ask your Sauron owner for an approved
secret-backed receiver setup; do not paste the webhook URL into the shared YAML.
Defining Multiple Routing to Ocean/Slack/Email for Metric Alerts
Alertmanager checks child routes in order, then uses the parent receiver if none matches. To combine the Ocean, email, or Slack receivers, add approved child routes to the existing configuration and test delivery for each route. See Alertmanager routing for the full syntax.
Log alerts in OpenSearch
Overview
Use OpenSearch Alerting when you need to alert on stored log events. First confirm a known event appears in OpenSearch Dashboards. Ask your Sauron owner whether log alerting and an approved test notification channel are available for this instance.
For more fields and current UI steps, see the OpenSearch Notifications guide.
In OpenSearch Dashboards, use this order:
- Create and update a monitor, which is a job that runs inside OpenSearch cluster at a pre-defined schedule and queries OpenSearch APIs or indices.
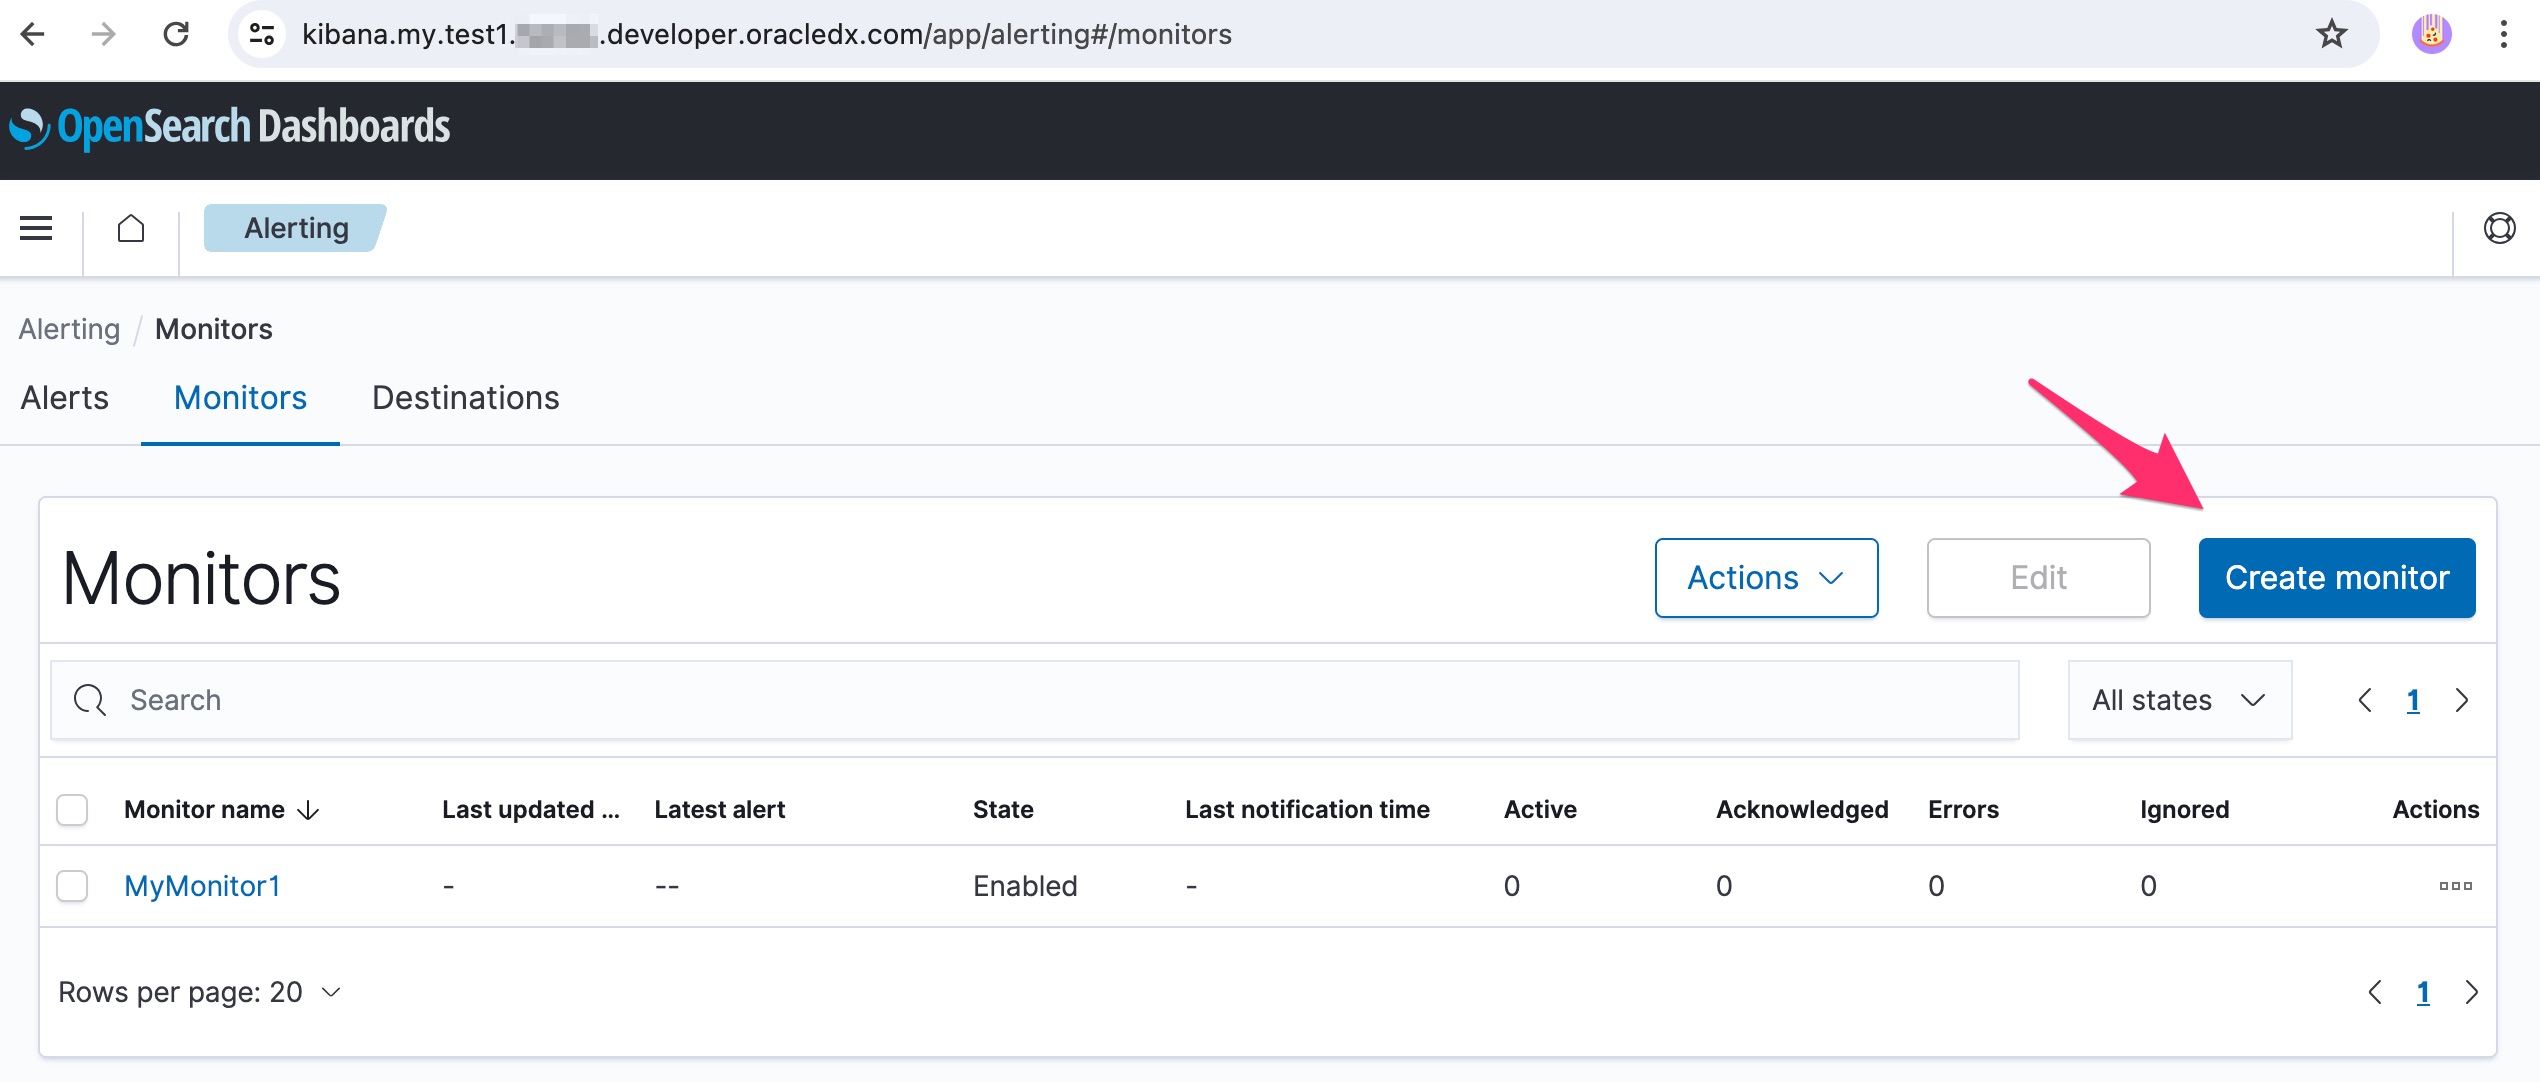
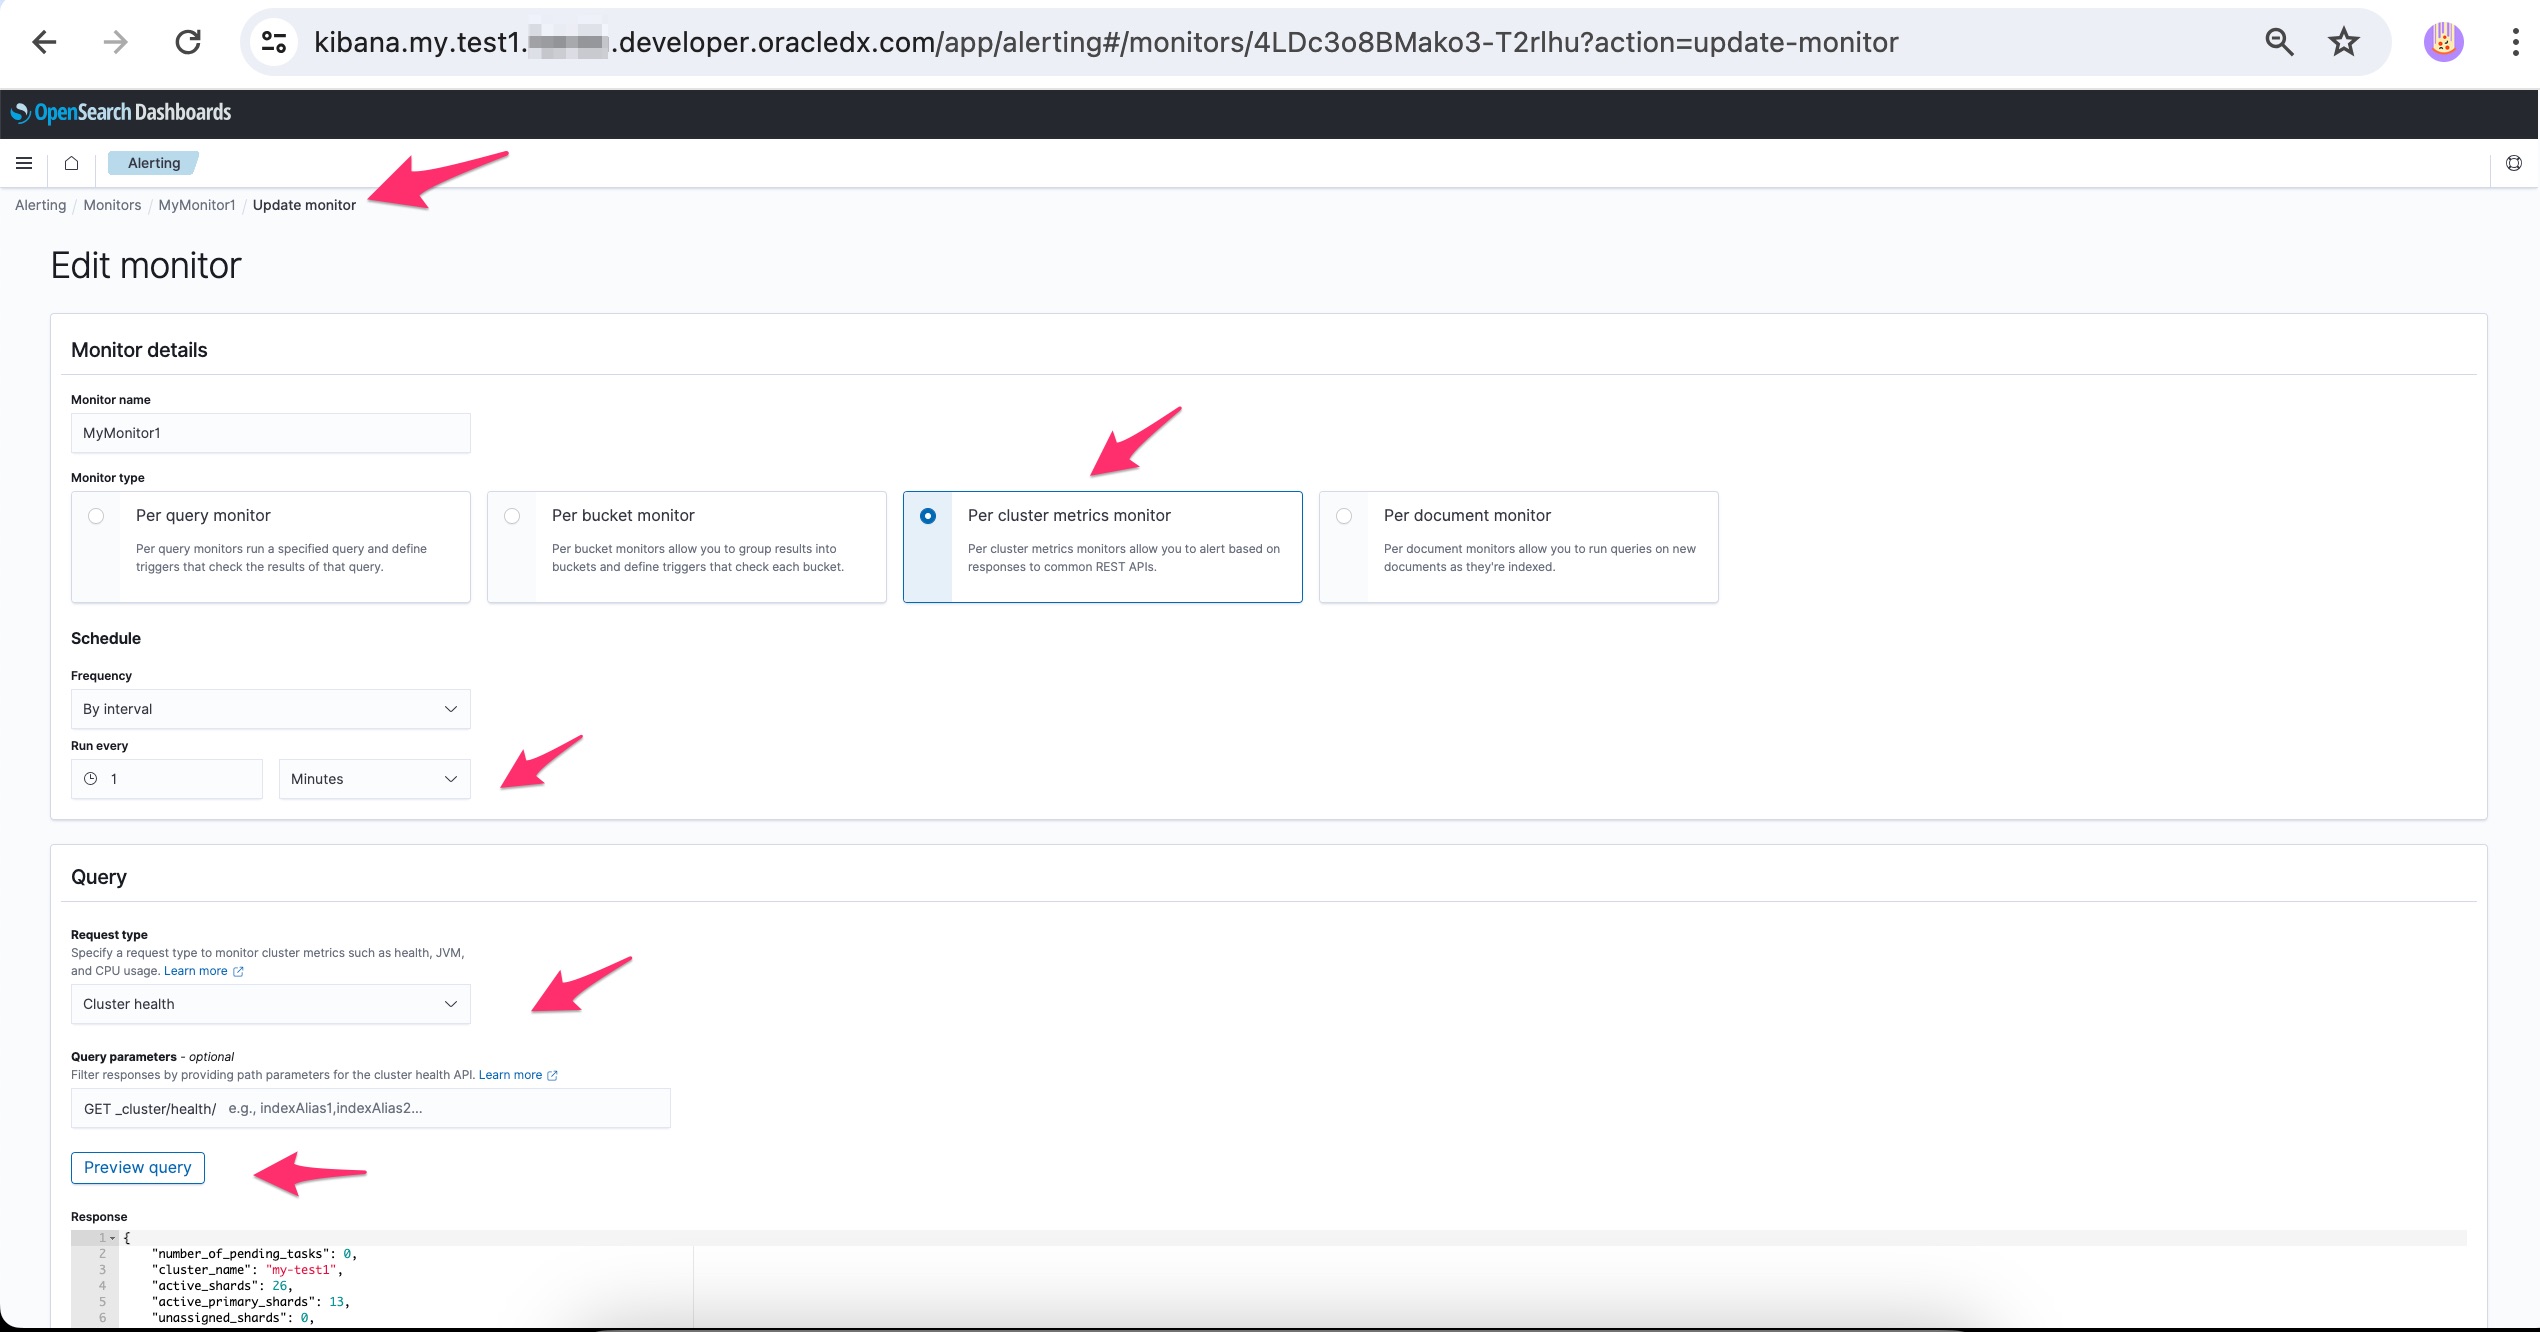
- Add one or more triggers, which define monitor job conditions that, once met, trigger alerts.
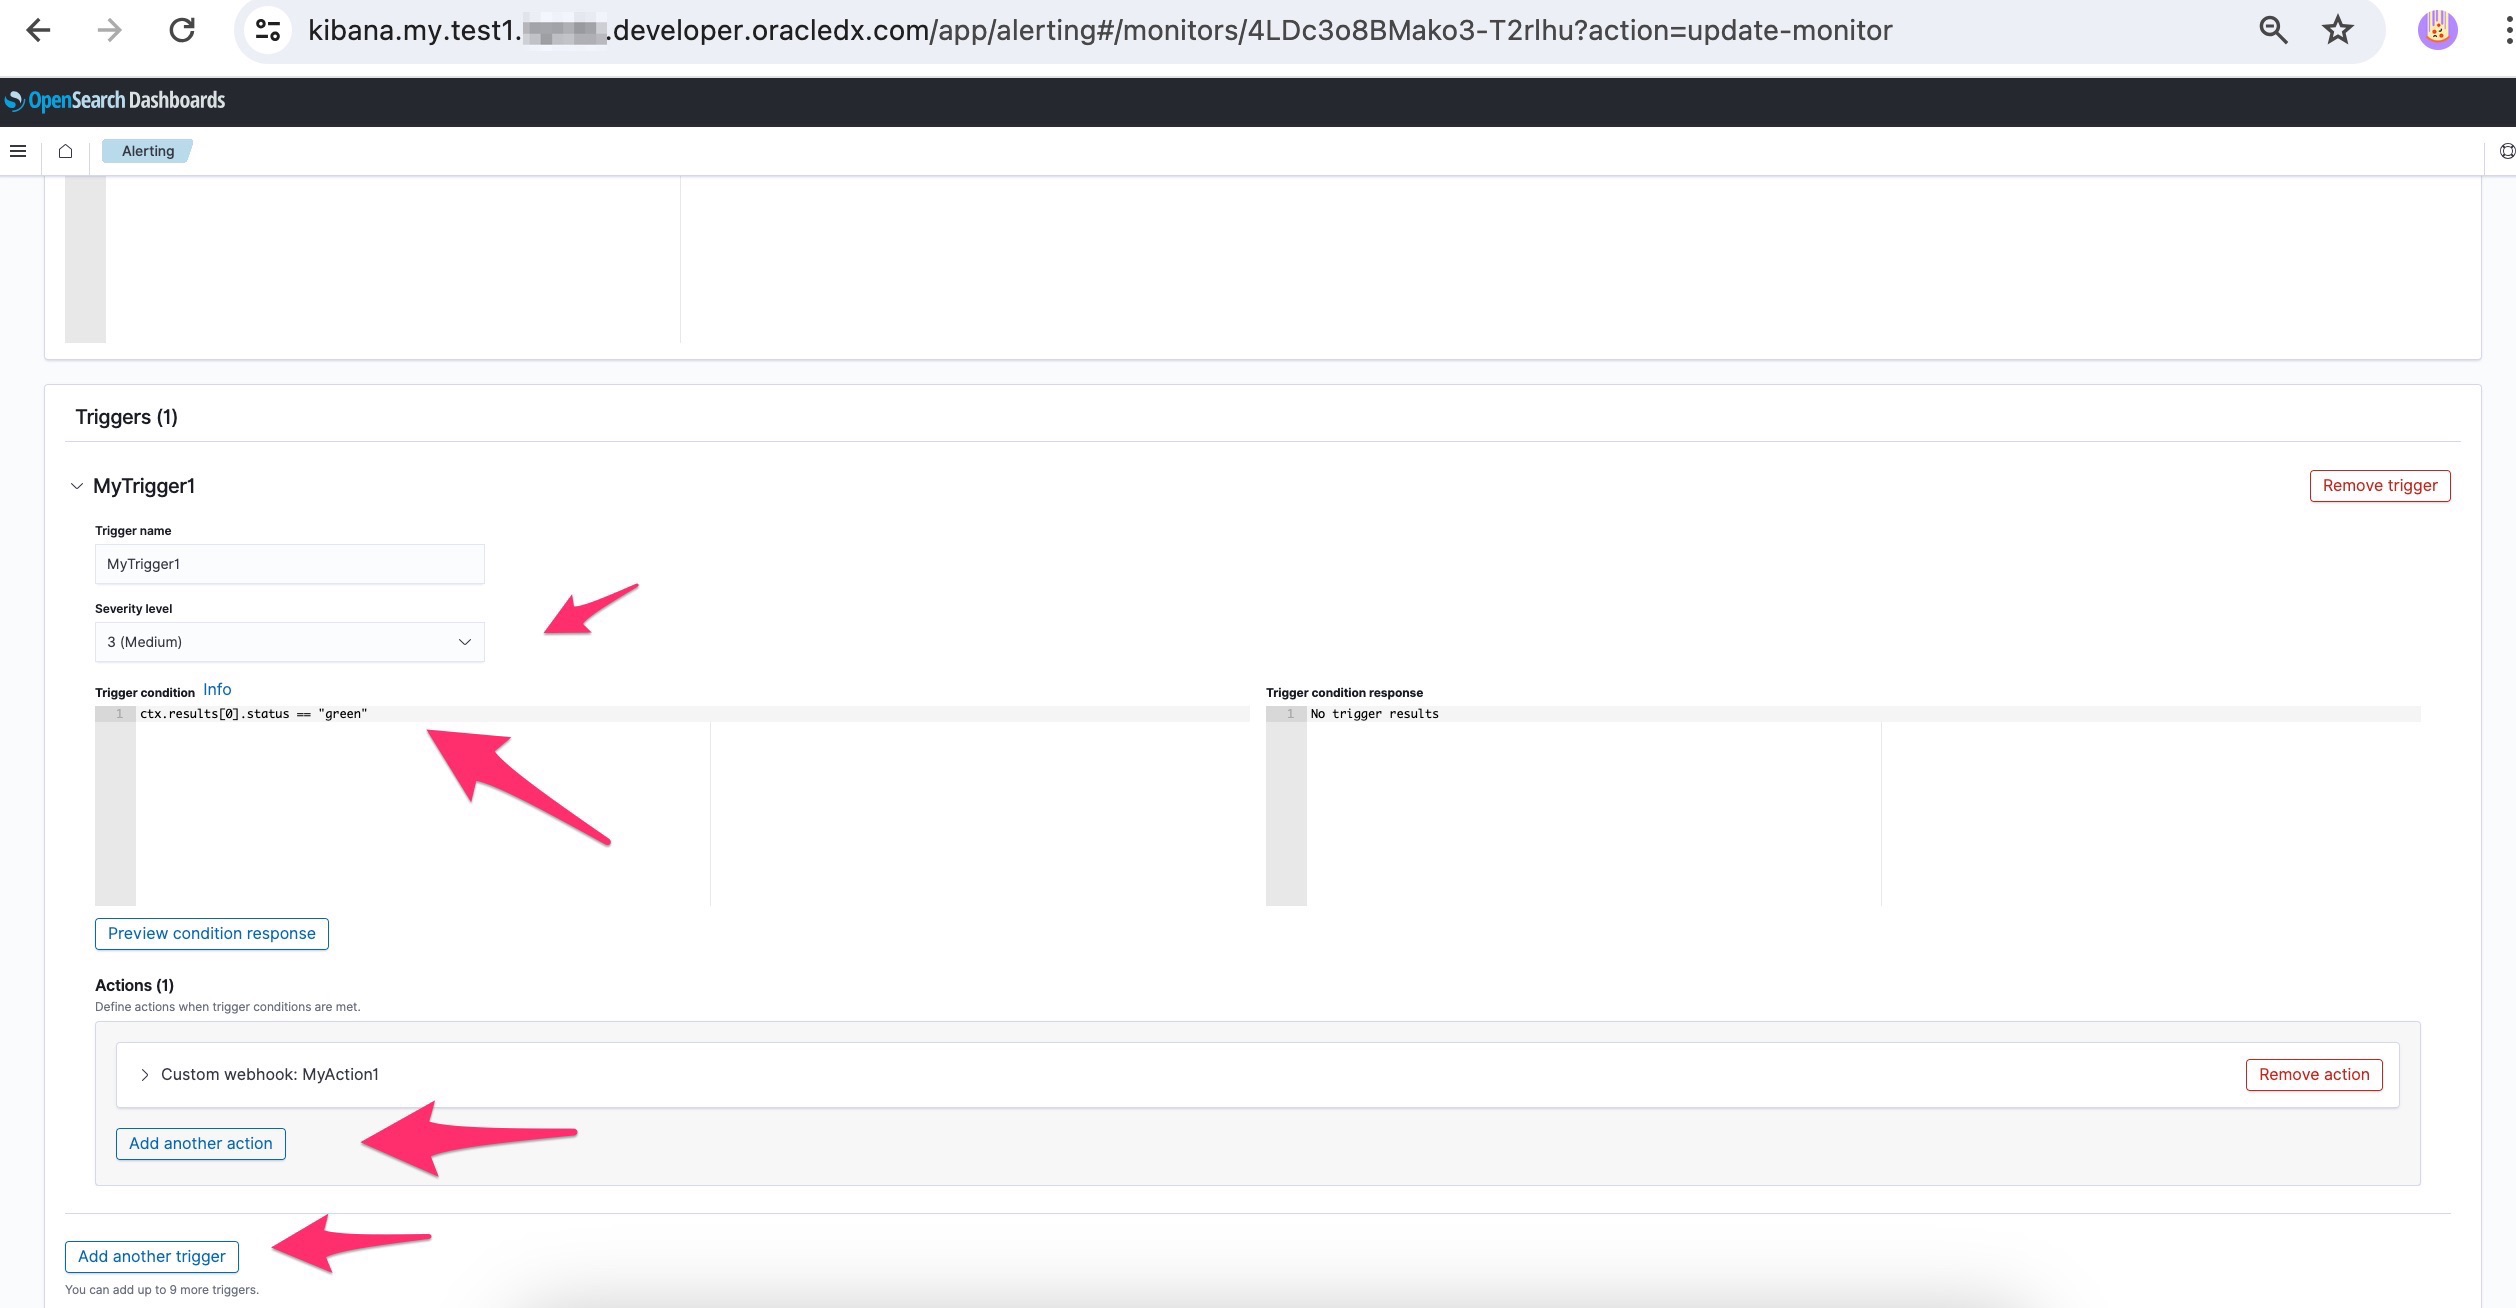
- Add one or more actions, which are what will happen once alert triggered, such as, sending notification to predefined notification channel.
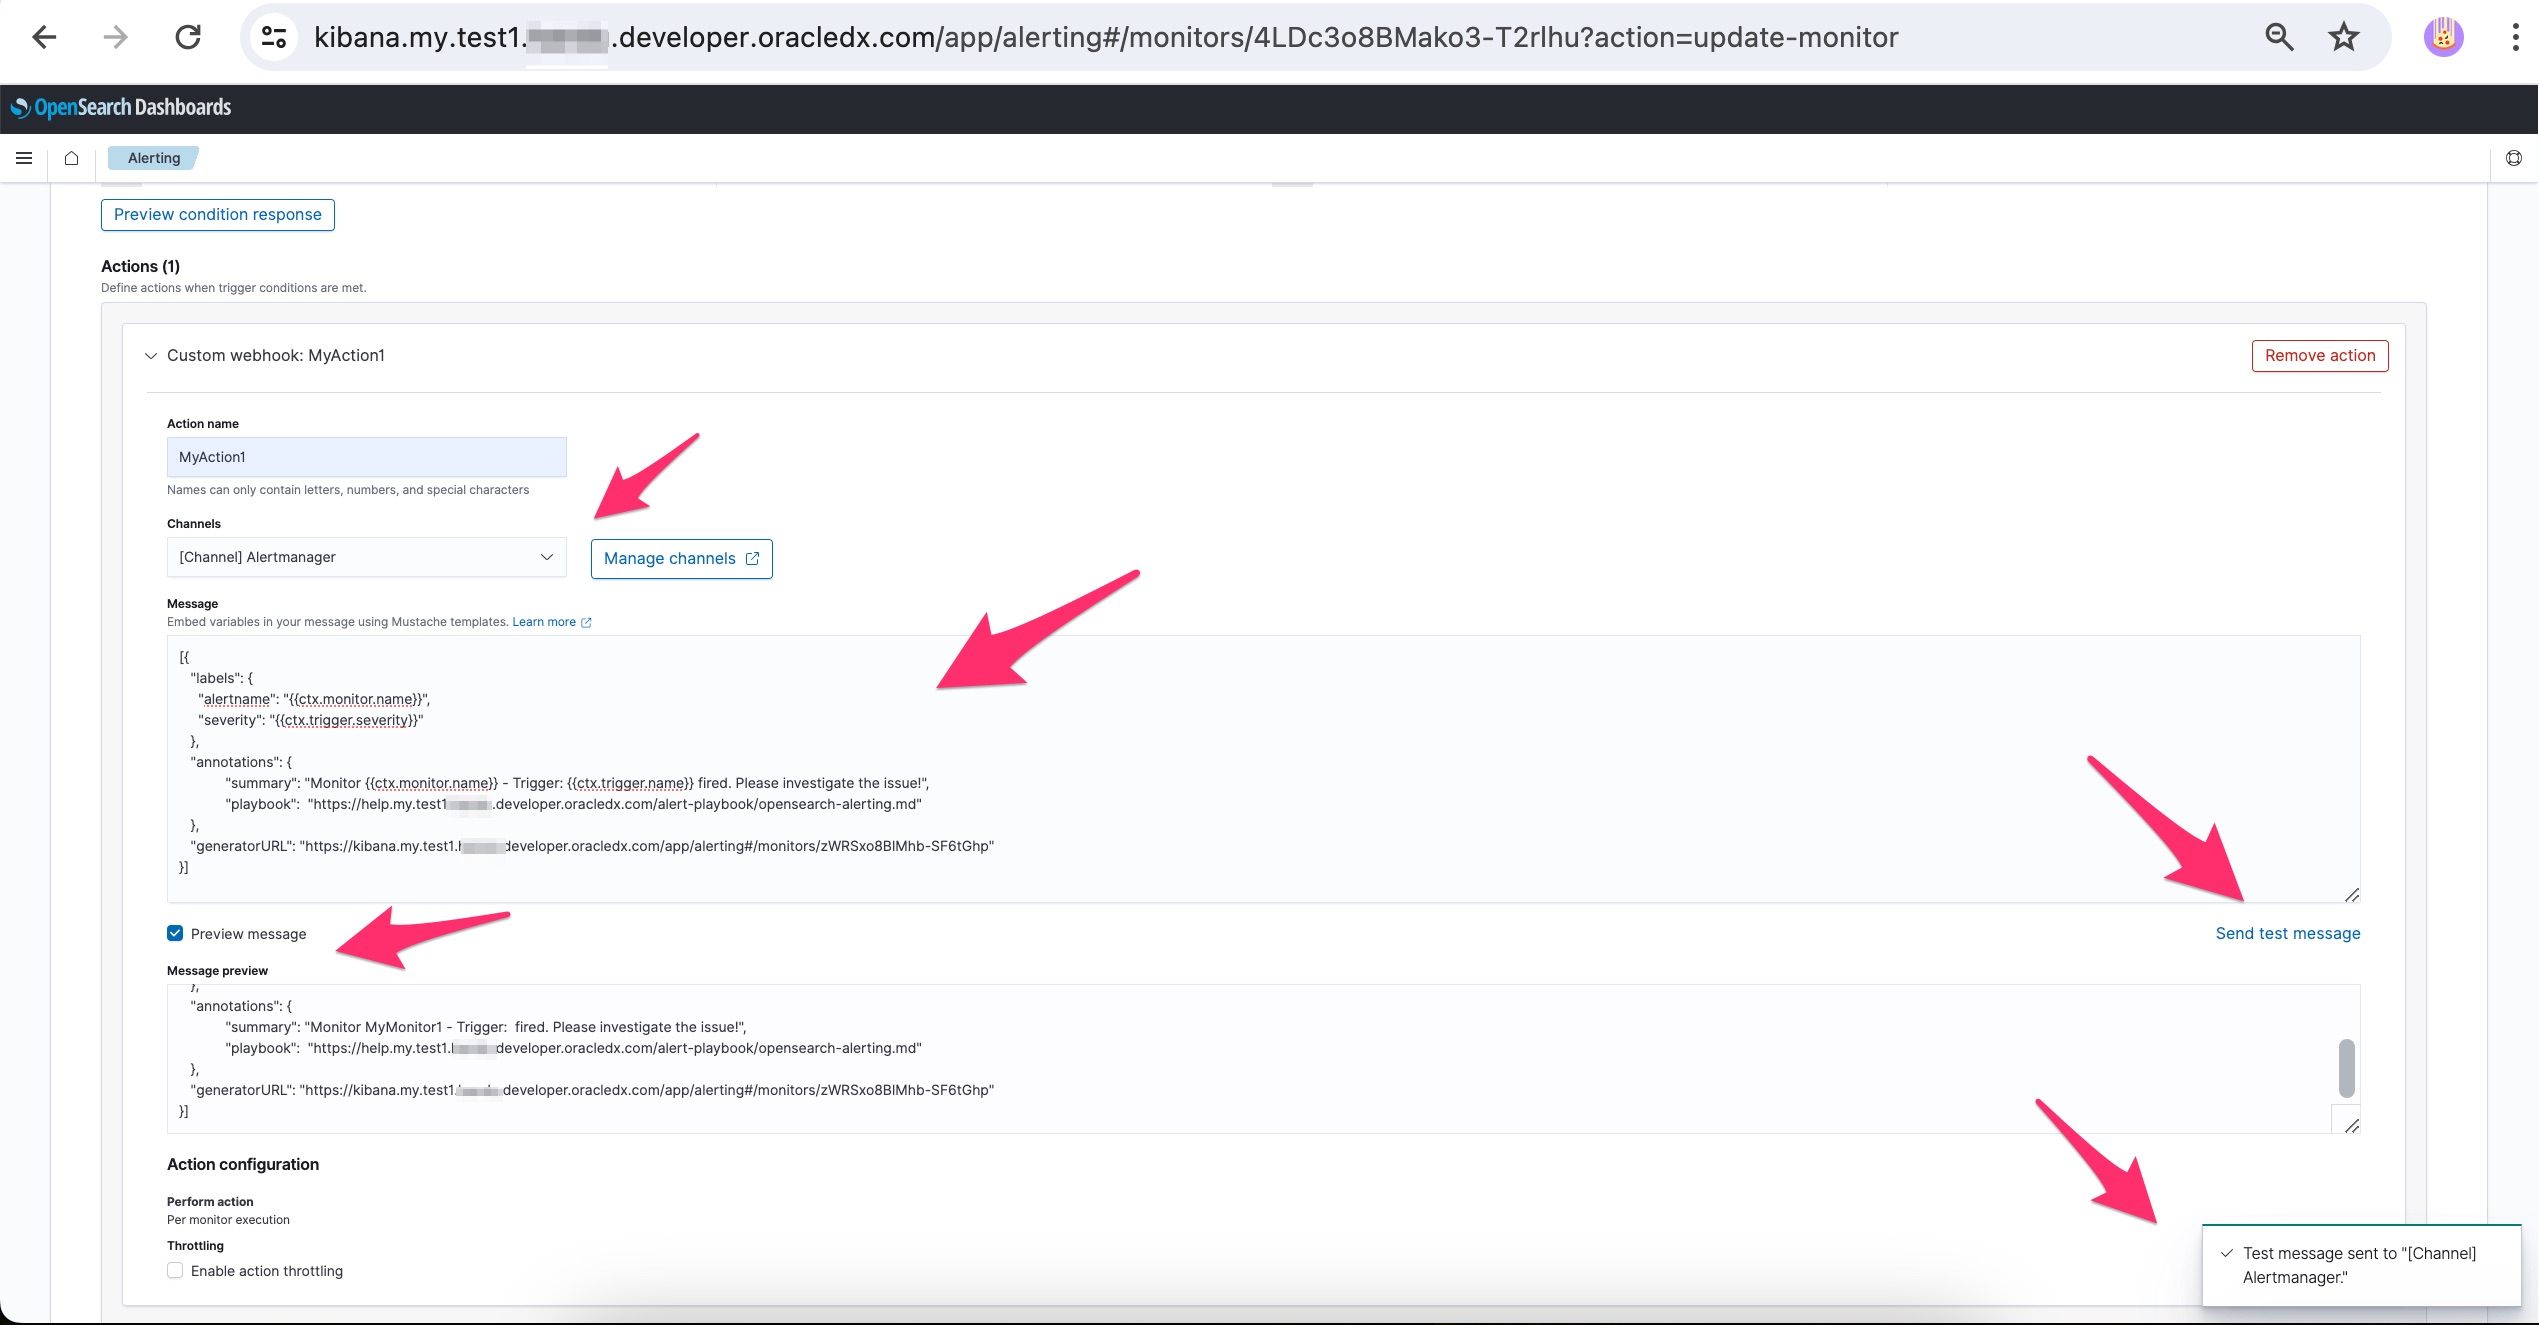
If the notification channel sends to Alertmanager, use an API v2 alert array as the action's Message. Test the rendered message with your OpenSearch owner; quotes or other special characters in template values may need escaping:
[{
  "labels": {
    "alertname": "{{ctx.monitor.name}}",
    "severity": "{{ctx.trigger.severity}}"
  },
  "annotations": {
    "summary": "Monitor {{ctx.monitor.name}}: trigger {{ctx.trigger.name}} fired"
  }
}]
- Create and edit a notification channel, which will be used to deliver notifications to incident management service, like Ocean.
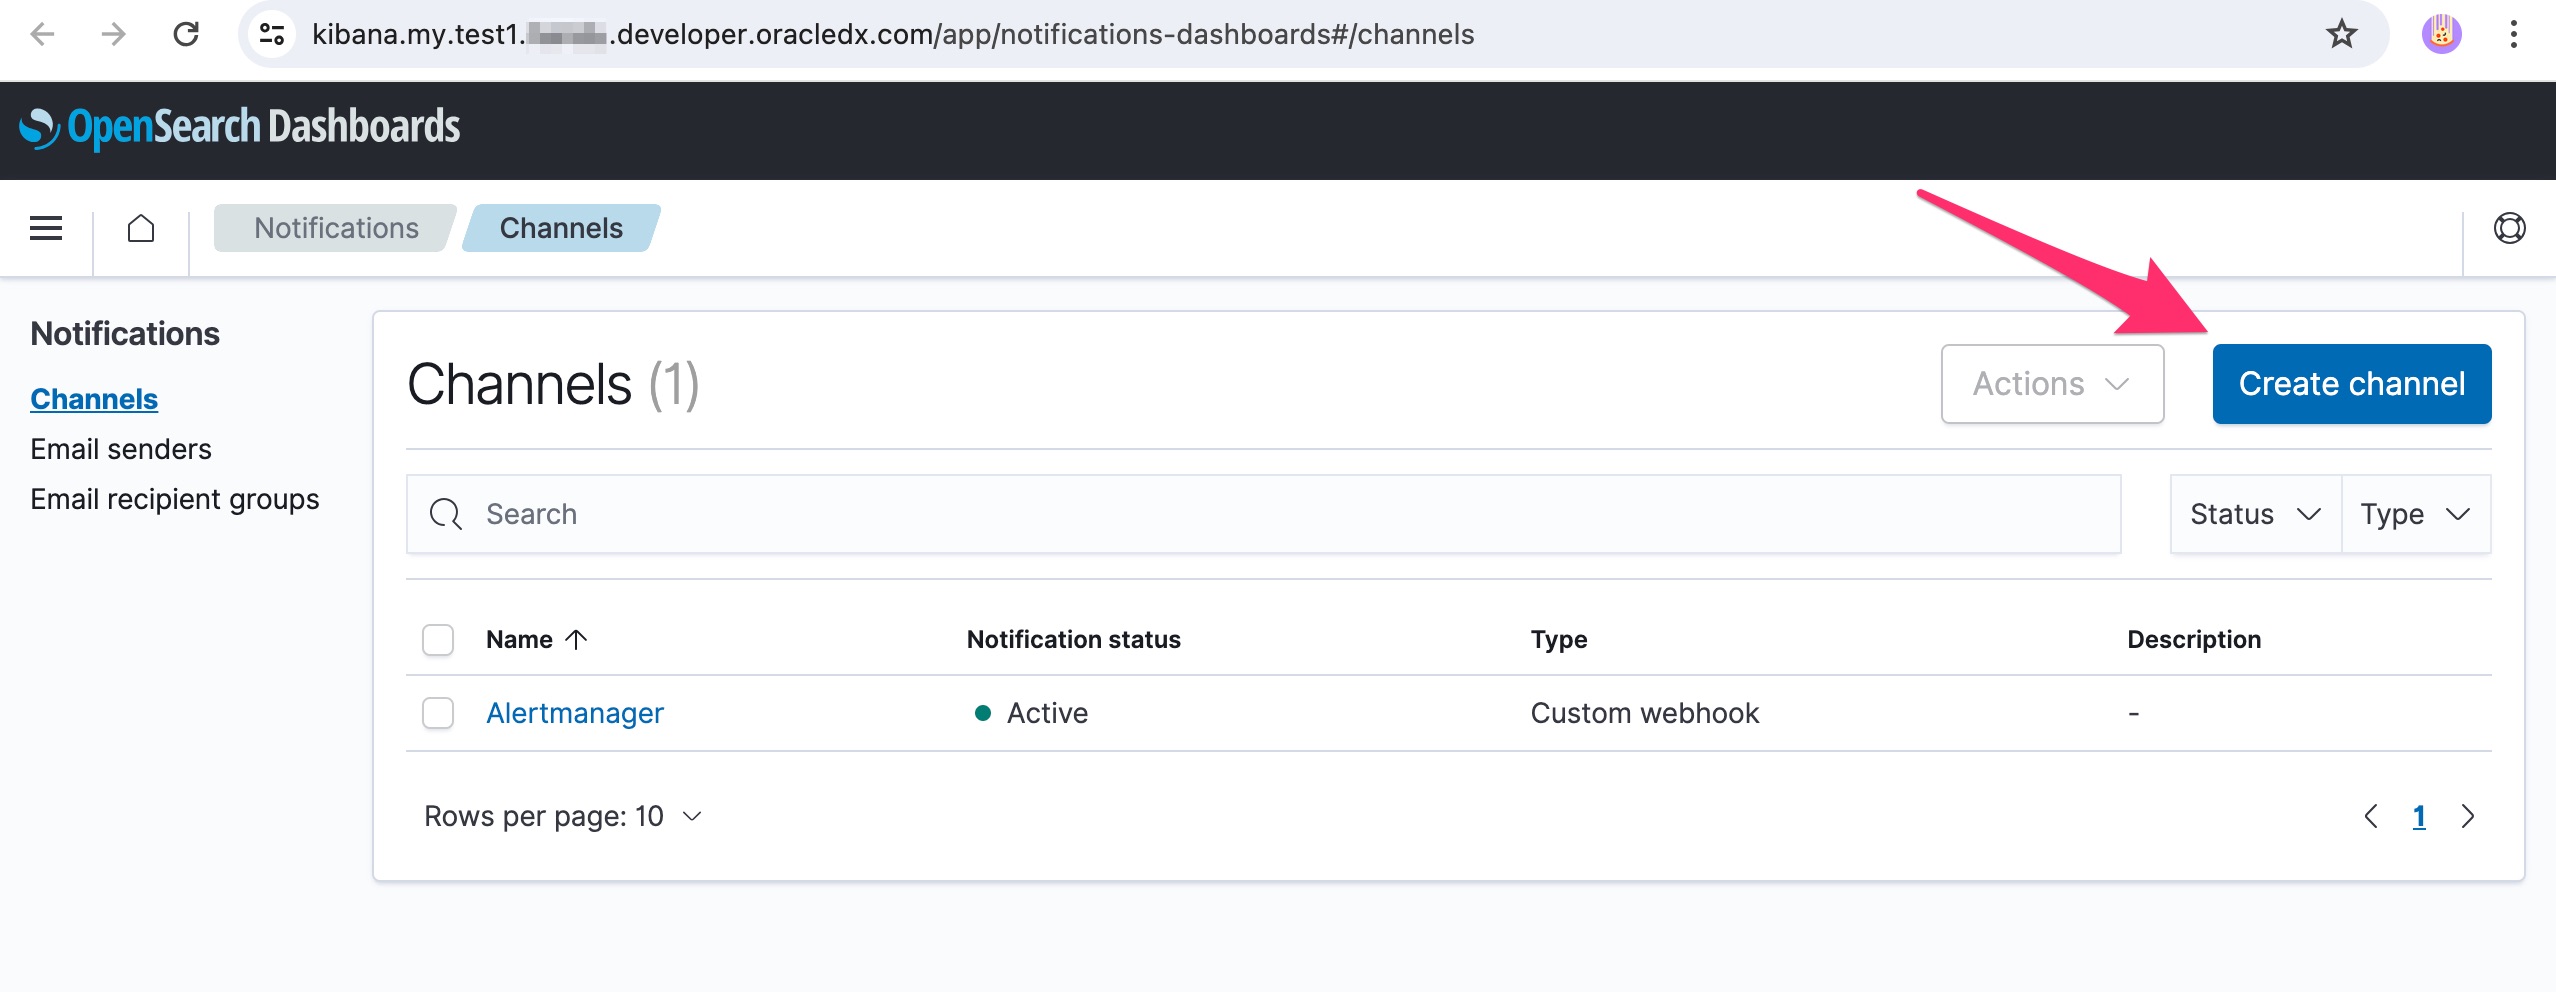
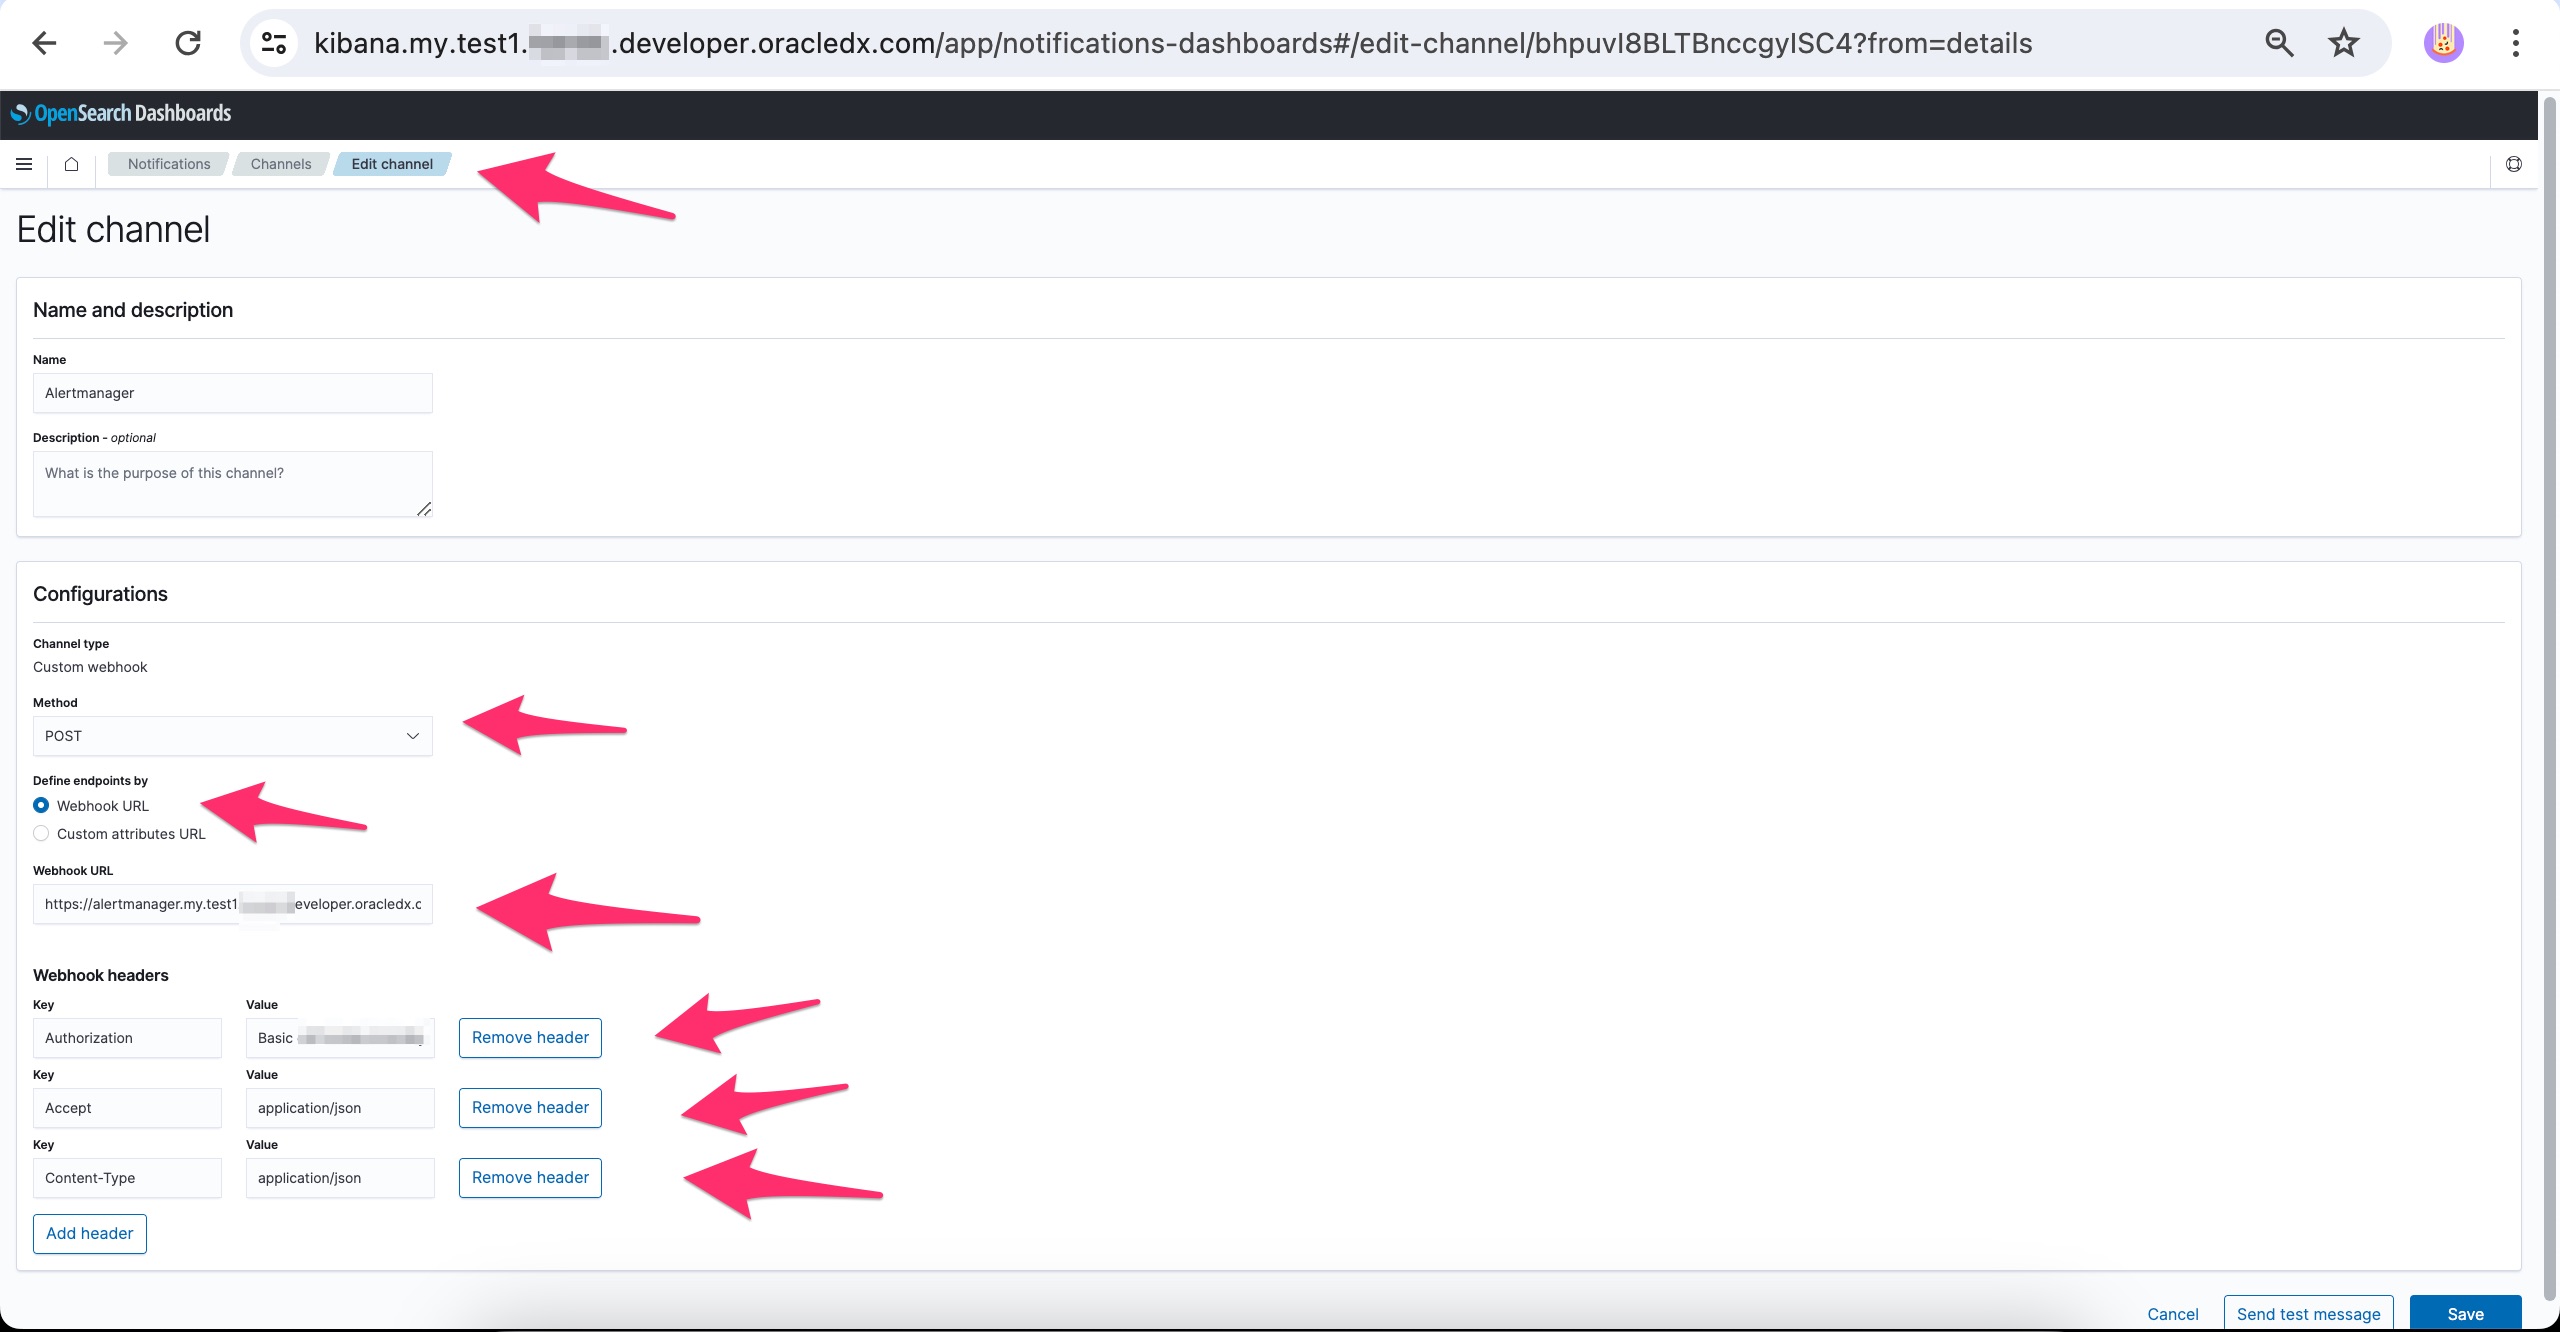
Set the webhook URL to
https://alertmanager.stage.apatil.developers.oracledx.com/api/v2/alerts and send
Content-Type: application/json. The endpoint also requires credentials
authorized for Alertmanager. Reporter credentials cannot access
Alertmanager. Ask the Sauron owner for the approved authentication method
for this integration, and keep the credential in the approved secret store.
Send a test notification and check the Alertmanager alert list before relying
on the channel.
Success: The monitor finds the expected test log, its trigger activates, and the approved test recipient receives a notification. If the monitor fires but delivery fails, check the channel credentials and route with your Sauron owner before using it for production.
Tips and checks
- Tips: Choose a condition someone can act on. Include a useful description and a link to recovery instructions. Prometheus alerting guidance.
- Check: If the rule is inactive, check its expression, evaluation error, and hold period. For a firing alert without a message, use the notification checks. Success means the recipient gets the message.