Sending Metrics
A metric is a measurement tracked over time, such as requests per minute or response time. Prometheus collects metrics from your service; Grafana shows them in charts. This page is for teams with a metrics source to connect. If you only want to look at existing charts, start with Explore your Sauron or view a dashboard.
Retention: Prometheus normally keeps metrics for 30 days. Your instance may differ; check Console → Instance. You can request a different retention period through an approved change. For older metrics, see Thanos retention.
Send your first metric
Start with a direct scrape: Prometheus reads measurements from your
service's /metrics web address.
/metrics endpoint and access to update a test Sauron. To check service behavior, also get one service metric name./metrics from a host that reaches the service; confirm it returns measurements.up{job="sauron-first-metric-test"} returns 1.Get the address from your service owner. If there is no /metrics endpoint,
that owner must add a metrics source first. Ask your Sauron owner for test
access, the intended network path, and a review of the shared configuration
before uploading changes.
For a dashboard about your service's behavior, also ask its owner for a metric
name; the up metric only checks whether Prometheus can scrape the endpoint.
Basic direct scrape test
The commands show this Sauron's configured API username; curl prompts for its password. Fetch the current configuration first:
umask 077
PROMETHEUS_BACKUP="$(mktemp /tmp/sauron-prometheus.XXXXXX)"
curl --fail --show-error -u 'sauron' \
  -o "$PROMETHEUS_BACKUP" \
  'https://api.stage.apatil.developers.oracledx.com/prometheus/config' && \
  cp "$PROMETHEUS_BACKUP" "${PROMETHEUS_BACKUP}.edited"
The file may contain credentials. Keep the original securely for rollback.
Add this job under scrape_configs: in ${PROMETHEUS_BACKUP}.edited. Replace
the host and port with a real test endpoint that exposes /metrics:
  - job_name: sauron-first-metric-test
    metrics_path: /metrics
    static_configs:
      - targets:
          - example-metrics-host:9100
Review diff -u "$PROMETHEUS_BACKUP" "${PROMETHEUS_BACKUP}.edited" and confirm only
this job was added. If you are unsure how to edit YAML or the diff shows other
changes, ask your Sauron owner to review the file. Upload the copy to the
same test Sauron you downloaded it from:
curl --fail --show-error -X PUT -i -u 'sauron' \
  --data-binary @"${PROMETHEUS_BACKUP}.edited" \
  'https://api.stage.apatil.developers.oracledx.com/prometheus/config'
After upload, check the connection; then check your service's data if you have a service metric name:
- Open Prometheus Targets and confirm
sauron-first-metric-testisUP. - Query
up{job="sauron-first-metric-test"}in Prometheus. A value of1means Sauron read the configured/metricsaddress on the last scrape; it does not prove your application is healthy. - If you have a service metric name, query it scoped to this job
(for example,
your_metric_name{job="sauron-first-metric-test"}). Replaceyour_metric_namewith the real name; confirm a recent value appears. - If Thanos is enabled for this Sauron, query the same metric there. Then graph it in Grafana.
Keep the private files until validation is complete; remove them when your owner confirms rollback copies are no longer needed.
For a restricted network, use PushProx. For an enabled OTLP receiver, use OpenTelemetry.
Collect Linux host metrics
Optional: Use node exporter when you want measurements about a Linux
host, such as CPU time and available memory. It exposes /metrics for
Prometheus to read; it does not send metrics by itself.
Ask your service owner for an approved Linux binary or package, the host's
reachable name, and permission to expose port 9100 on the intended network.
Ask your Sauron owner to review the scrape change. The commands below assume
an extracted binary; use the owner's service instructions for an installed
package. If node exporter is already running, reuse its approved endpoint.
For a temporary test, open a terminal on the Linux host and change to the
directory containing the extracted node_exporter binary. Run it and leave
the terminal open:
./node_exporter
In another terminal on that host, check the output:
curl --fail --show-error http://localhost:9100/metrics
Check: The response contains node_cpu_seconds_total. If it is missing,
ask the service owner to check the CPU collector. A local check alone does
not prove Sauron can reach the host.
Follow the direct scrape test, replacing its
target with metrics-host:9100. Here, metrics-host means the real hostname
or address Sauron can reach; keep the test job name
sauron-first-metric-test. Reuse that job if you already created it.
Success: The target is UP, and this query returns recent values:
node_cpu_seconds_total{job="sauron-first-metric-test"}
This metric records accumulated CPU time, not a CPU percentage. Next, create a dashboard or use PushProx if Sauron cannot reach the host directly.
When finished, press Ctrl-C in the terminal running the temporary exporter. With your Sauron owner, remove only this test job from a fresh copy of the shared configuration and follow the same review/upload procedure. Keep an existing exporter running if other monitoring uses it.
Further reading: Prometheus node exporter guide.
Prove it works before production
Repeat the target and service-metric checks in production using the agreed scrape interval and data volume.
Direct Prometheus scrape reference
The sections below are for TLS, network policy, Kubernetes discovery, and restricted networks. You can stop after the first metric check if none applies.
Security List Configuration
Your network security list must allow Sauron Prometheus to reach your metrics endpoint. Get this Sauron's current source CIDRs from the API:
curl --fail --show-error -u 'sauron' 'https://api.stage.apatil.developers.oracledx.com/v1/cidrs'
Example of the returned output:
["192.0.2.0/30","192.0.2.5/32","192.0.2.192/28"]
Use maxBitsToMask to control the maximum unspecified bits of each CIDR:
curl --fail --show-error -u 'sauron' \
  'https://api.stage.apatil.developers.oracledx.com/v1/cidrs?maxBitsToMask=9'
Sauron Prometheus can run on different nodes. Recheck the returned CIDRs when network policy changes and allow all current sources needed for your scrape.
Pulling
Use the direct scrape steps to fetch, preserve, edit, and upload the existing config. Prometheus also supports authenticated and TLS scrape jobs. Keep existing jobs and alerting settings when adding yours. Your service or network owner must allow Sauron Prometheus to reach the target.
Pulling metrics with TLS Enabled.
For secure installations you may need to enable https on your scrape endpoints.
The following prometheus.example.com address stands for a metrics endpoint
owned by your service. Replace it with your real target; it is not a Sauron
address. If that endpoint uses TLS, you can configure Prometheus as follows:
- job_name: 'node'
  scheme: https
  tls_config:
    ca_file: /etc/prometheus/tls/prometheus.example.com-endpoint-chain.crt
  metrics_path: /metrics
  static_configs:
    - targets: ['prometheus.example.com']
If the endpoint uses a CA that Sauron Prometheus does not already trust,
upload the approved CA chain through the Prometheus TLS certificate API and
point ca_file to its mounted path, as shown above. Omit tls_config.ca_file
when the server certificate already chains to a trusted CA. For mutual TLS,
also configure the approved client certificate and key.
If Prometheus cannot validate the endpoint certificate, confirm its hostname
and upload the approved CA chain. Do not disable certificate verification to
work around an unknown certificate or trust error.
Use /federate when your team already runs Prometheus near its service; use
/metrics for an individual exporter or application endpoint.
Federated
To collect from a Prometheus owned by your team:
 - job_name: My-Federate-Job
   honor_labels: true
   scheme: https
   metrics_path: /federate
   params:
     'match[]':
       - '{job="your-service-job"}'
   basic_auth:
       username: myuser
       password_file: /etc/prometheus/auxiliaryfiles/my-federation-password
   static_configs:
     - targets: ["prometheus.your-team.example.com"]
Replace your-service-job with an approved source job; collect only the
metrics you need. In this example, your team's Prometheus is reachable over HTTPS at
prometheus.your-team.example.com. Upload the password as a restricted
Prometheus auxiliary file and use its mounted path in password_file. Replace
the example hostname with your actual scrape target; do not point federation
back at the same Sauron Prometheus instance.
For Kubernetes
services already running kube-prometheus,
check that their Prometheus exposes /federate and Sauron can reach it before
using this pattern.
For direct /metrics targets, use the
first scrape example.
Auxiliary configuration files
For changing targets or credentials, keep them in restricted auxiliary files
instead of placing secrets in the main config. Reference these files with
file_sd_configs, password_file, or authorization.credentials_file.
Replace metrics-host with your approved target before uploading:
cat > my-scrape-job.yaml << EOF
- targets:
  - metrics-host:9100
  labels:
    mysauron: stage.apatil.developers.oracledx.com
EOF
umask 077
cat > my-scrape-job.token << 'EOF'
replace-with-your-scrape-token
EOF
Upload both files through the Sauron API:
curl --fail --show-error -X PUT -i -u 'sauron' https://api.stage.apatil.developers.oracledx.com/v1/prometheus/auxiliaryfiles/my-scrape-job.token --data-binary "@my-scrape-job.token"
curl --fail --show-error -X PUT -i -u 'sauron' https://api.stage.apatil.developers.oracledx.com/v1/prometheus/auxiliaryfiles/my-scrape-job.yaml --data-binary "@my-scrape-job.yaml"
And reference them from the Prometheus configuration e.g.
  - job_name: My-Scrape-Job
    authorization:
      credentials_file: /etc/prometheus/auxiliaryfiles/my-scrape-job.token
    file_sd_configs:
      - files:
          - /etc/prometheus/auxiliaryfiles/my-scrape-job.yaml
Replace the token and target placeholders before upload. Confirm the updated target in Prometheus Targets, then remove the local token file securely.
Configuration from Kubernetes Pods
If your Kubernetes application already emits StatsD metrics, you can run a
StatsD exporter beside it and expose the exporter's Prometheus metrics port
(normally TCP/9102). Use an image and version approved for your team; do not
deploy an unpinned latest image from this guide. Confirm the application
can send StatsD packets to the exporter and that its /metrics endpoint
contains the expected metric before adding a Sauron scrape target.
For a pod labeled app: service1 with an exporter port named
statsd-exporter, expose that port through a Kubernetes Service:
apiVersion: v1
kind: Service
metadata:
  name: service1
  labels:
    app: service1
    k8s-app: service1
spec:
  type: NodePort
  ports:
  - name: web
    protocol: TCP
    port: 8080
    targetPort: web
  - name: statsd-exporter
    protocol: TCP
    port: 9102
    targetPort: statsd-exporter
  selector:
    app: service1
If your cluster has a Prometheus Operator configured to watch ServiceMonitors, you can create one for that Service. Check its label and namespace selectors against your operator setup:
apiVersion: monitoring.coreos.com/v1
kind: ServiceMonitor
metadata:
  name: service1
  labels:
    k8s-app: service1
spec:
  jobLabel: k8s-app
  selector:
    matchLabels:
      k8s-app: service1
  namespaceSelector:
    matchNames:
    - default
  endpoints:
  - port: statsd-exporter
    interval: 10s
Restricted network and push options
OpenTelemetry pushes metrics to an enabled receiver. PushProx does not push metrics: it lets Sauron Prometheus scrape through a client and proxy. Choose the path approved for this instance and its network.
OpenTelemetry and the OpenTelemetry Collector
An OpenTelemetry Collector can forward application metrics to Sauron's Prometheus OTLP receiver. Use this path only when direct scraping is unsuitable.
Before you start: Ask your Sauron owner whether the Prometheus OTLP receiver is enabled for this instance, which endpoint is approved, and which API account can write to it. Prometheus does not enable its OTLP receiver by default. Confirm the collector image and version with your team's image owner; this page does not identify a current approved Sauron collector image.
- Follow the Prometheus OTLP receiver guide and Collector configuration guide for your approved versions.
- Configure an OTLP HTTP metrics exporter for the approved Sauron endpoint. Supply credentials through your team's approved secret mechanism. Do not put a password in a ConfigMap, checked-in YAML, or a shared example.
- Send one uniquely named test metric from your application or collector.
- Query that metric in this Sauron's Prometheus. If it is absent, inspect collector export errors, receiver enablement, endpoint, access, and labels before asking the Sauron team to investigate.
PushProx
For a target in a restricted tenancy, first ask your Sauron owner whether PushProx is enabled. PushProx lets Sauron Prometheus scrape a target it cannot reach directly. Run the client where it can reach the target; the Sauron proxy connects that client to Prometheus. See the PushProx project for its client options.
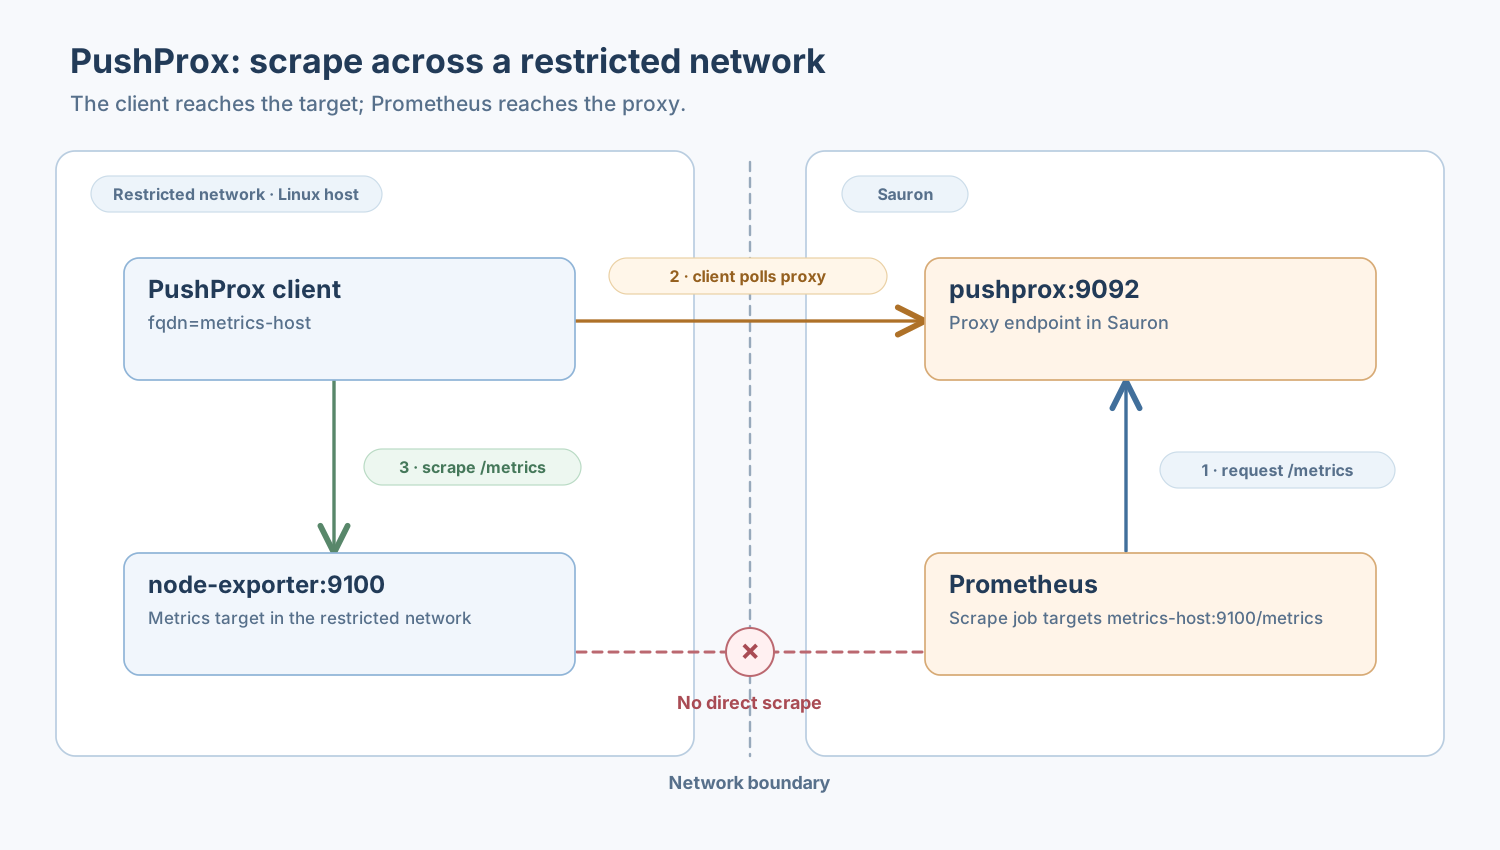
Use one client per target, one client for several reachable targets, or one client to federate from a Prometheus near your service. Choose based on what the client host can reach.
Enable PushProx Proxy
Ask your Sauron owner whether PushProx is enabled and which client credential and endpoint to use. An authorized admin can enable it through PUT /v1/pushprox/actions.
Run PushProx client
Get the approved binary or image from Client-side Container Images.
The commands below assume an extracted client binary. Ask its image owner
for the binary path and confirm that build supports the Sauron credential-file
setting and flags shown below; inspect ./pushprox-client --help.
Use Basic Auth credentials
First get an enabled test PushProx endpoint, approved client, and credentials
from your Sauron owner; check the client's supported flags with --help.
Use the Linux host example as the target.
Replace metrics-host with a name that resolves to that host from the client.
First, check from the client host:
curl --fail --show-error http://metrics-host:9100/metrics
Use approved reporter credentials in a protected file containing
username:password, readable only by the client account (for example, mode
0600). Keep it out of source control. Replace the credentials path below
with its absolute path, then start the client:
export PUSHPROX_USER_PASSWORD_FILE=/path/to/restricted/pushprox-creds
./pushprox-client \
  --proxy-url=https://pushprox.stage.apatil.developers.oracledx.com/ \
  --fqdn=metrics-host \
  --url-whitelist=metrics-host:9100
Having a metrics exporter running on client side
The check must return node_cpu_seconds_total before you continue. For
another exporter, use its approved host, port, and metric name throughout.
Configuring Prometheus to use PushProx while scraping
Once enabled, Sauron adds a PushProx scrape job. Keep its generated
job_name, proxy_url, and existing targets. Add metrics-host:9100 to its
target list; this is the shape of the added entry:
static_configs:
  - targets: ['metrics-host:9100']
The hostname must match the client's --fqdn. Follow the shared configuration
download, review, and upload procedure on your test
Sauron, editing the existing PushProx job instead of adding a direct job.
Verify the setup
- Check that
metrics-hostis registered on PushProx status. - Open Prometheus Targets and confirm its
PushProxtarget is UP. - Query the host measurement in Prometheus:
node_cpu_seconds_total{job="PushProx",instance="metrics-host:9100"}
Success: Recent host measurements appear. If your job rewrites labels,
use the actual job and instance labels shown on Targets. For cleanup,
remove only your test target using the same configuration procedure and stop
the temporary client with Ctrl-C; keep a client that serves other targets.
Use OAuth 2.0 Bearer token
For PushProx on a test Sauron, use an approved client and reporter-role OAuth 2.0 Bearer token. Keep the target, registration name, and whitelist from the Basic Auth setup:
read -r -s -p 'Sauron bearer token: ' SAURON_BEARER_TOKEN; echo
umask 077
printf '%s' "${SAURON_BEARER_TOKEN}" | base64 | tr '+/' '-_' | tr -d '\n' > myTokenFile

./pushprox-client \
  --proxy-url=https://pushprox.stage.apatil.developers.oracledx.com/ \
  --fqdn=metrics-host --url-whitelist=metrics-host:9100 \
  --bearertokenfile=./myTokenFile
Remove myTokenFile when the client no longer needs it. Keep it out of source
control and shared logs.
Provide URL whitelist
The first client command limits scraping to metrics-host:9100 through
--url-whitelist. Update this restriction to the approved hosts and ports
when using another target; confirm the syntax in your approved client's help.
Multiple scrape targets
For several hosts reachable from the client, replace --fqdn with
--fqdnList=host1,host2. Each name must resolve on the client host. For a
local-only target, use --fqdn=localhost and include localhost in
NO_PROXY. Check client registration at
PushProx status.
Troubleshooting
Tips: Limit the whitelist to intended metrics endpoints and keep credentials in a protected file.
Check: Confirm client registration and matching client/target names, then check target UP and a recent service metric.
Add --debug=true to your chosen client command to inspect registration.
For the Basic credentials setup, keep PUSHPROX_USER_PASSWORD_FILE set:
./pushprox-client \
  --proxy-url=https://pushprox.stage.apatil.developers.oracledx.com/ \
  --fqdn=metrics-host --url-whitelist=metrics-host:9100 --debug=true
For Bearer authentication, also retain --bearertokenfile. Check the target's
hostname, port, HTTP/HTTPS settings, and error on Prometheus Targets. Share
only client log lines with credentials and tokens removed. If the local
exporter check fails, contact the service owner; if the client cannot reach
the Sauron proxy, contact the Sauron and network owners.
Further reading: PushProx configuration and pull model.
Querying Metrics
Not sure which to open? See Prometheus or Thanos?.
Open Prometheus to try a PromQL query.
You can also query metrics in Grafana when creating a dashboard.
Check a metric in Thanos
Thanos searches metrics from the Prometheus sources connected to it. If Console Endpoints does not list Thanos, ask your Sauron owner whether it is available for this instance.
- In Prometheus, run a query for a metric that has recent data. Note the time range.
- Open Thanos and run the same query with the same time range.
- Confirm the metric appears. If it does not, check the time range and labels, then ask your Sauron owner whether that Prometheus source is connected to this Thanos view.
To include metrics from another Sauron, see the advanced additional stores guide.
Built-In Sauron Metrics
Your Sauron's Prometheus comes preconfigured with a set of built-in scrape targets, for metric sources of its internal
components, like OpenSearch Dashboards, OpenSearch, and Prometheus itself. These targets are labeled with a mysauron label.
If your own queries (from Grafana dashboards, Prometheus alert rules, or elsewhere) need to refer to metric names (from your own metric sources)
that are the same as those from the Sauron built-in metric sources, you can add mysauron!~".+" to these queries to omit
the Sauron built-in metric sources. For example: elasticsearch_cluster_health_number_of_nodes{mysauron!~".+"}
Tips and checks
- Tips: Agree on the scrape interval and data volume before production. Avoid labels containing user or request IDs. Prometheus naming guidance.
- Check: Open Prometheus Targets and read any scrape error. Check the target address, port, credentials, and network access. Once it is UP, query an expected service metric; if missing, check the metric name and time range.