Sauron Architecture
Use this page to understand how Sauron endpoints, routing, metrics, logs, and alerts fit together. If you are troubleshooting a specific workflow, start with the task page for that workflow and use this page for the bigger picture.
| Component | Role in the architecture |
|---|---|
| Sauron instance | The isolated set of Sauron deployments, services, storage, and ingress for one service team environment. |
| Ingress, load balancer, and DNS | Route customer traffic to the correct Sauron endpoint. |
| Grafana | Displays dashboards and panels backed by Sauron metrics data. |
| Prometheus and Thanos | Scrape, store, evaluate, and query metrics. |
| Alertmanager | Routes metric alerts to configured receivers. |
| OpenSearch and OpenSearch Dashboards | Store, search, and inspect logs. |
| API Server and Console | Provide supported configuration/status APIs and browser-based Sauron status views. |
| Sauron Operator | Reconciles the Kubernetes resources that make up a Sauron instance. |
When This Page Helps
Use this page when you need to understand:
- Why each Sauron has separate endpoint hostnames.
- How browser and client requests reach Grafana, Prometheus, Thanos, Alertmanager, OpenSearch, Help, API, or Console.
- Which component to check first for endpoint routing, DNS, certificate, or network allowlist questions.
- How metrics flow from exporters into Prometheus, Alertmanager, Thanos, and Grafana.
- Where the Sauron Operator fits in the platform.
Customer Endpoint Flow
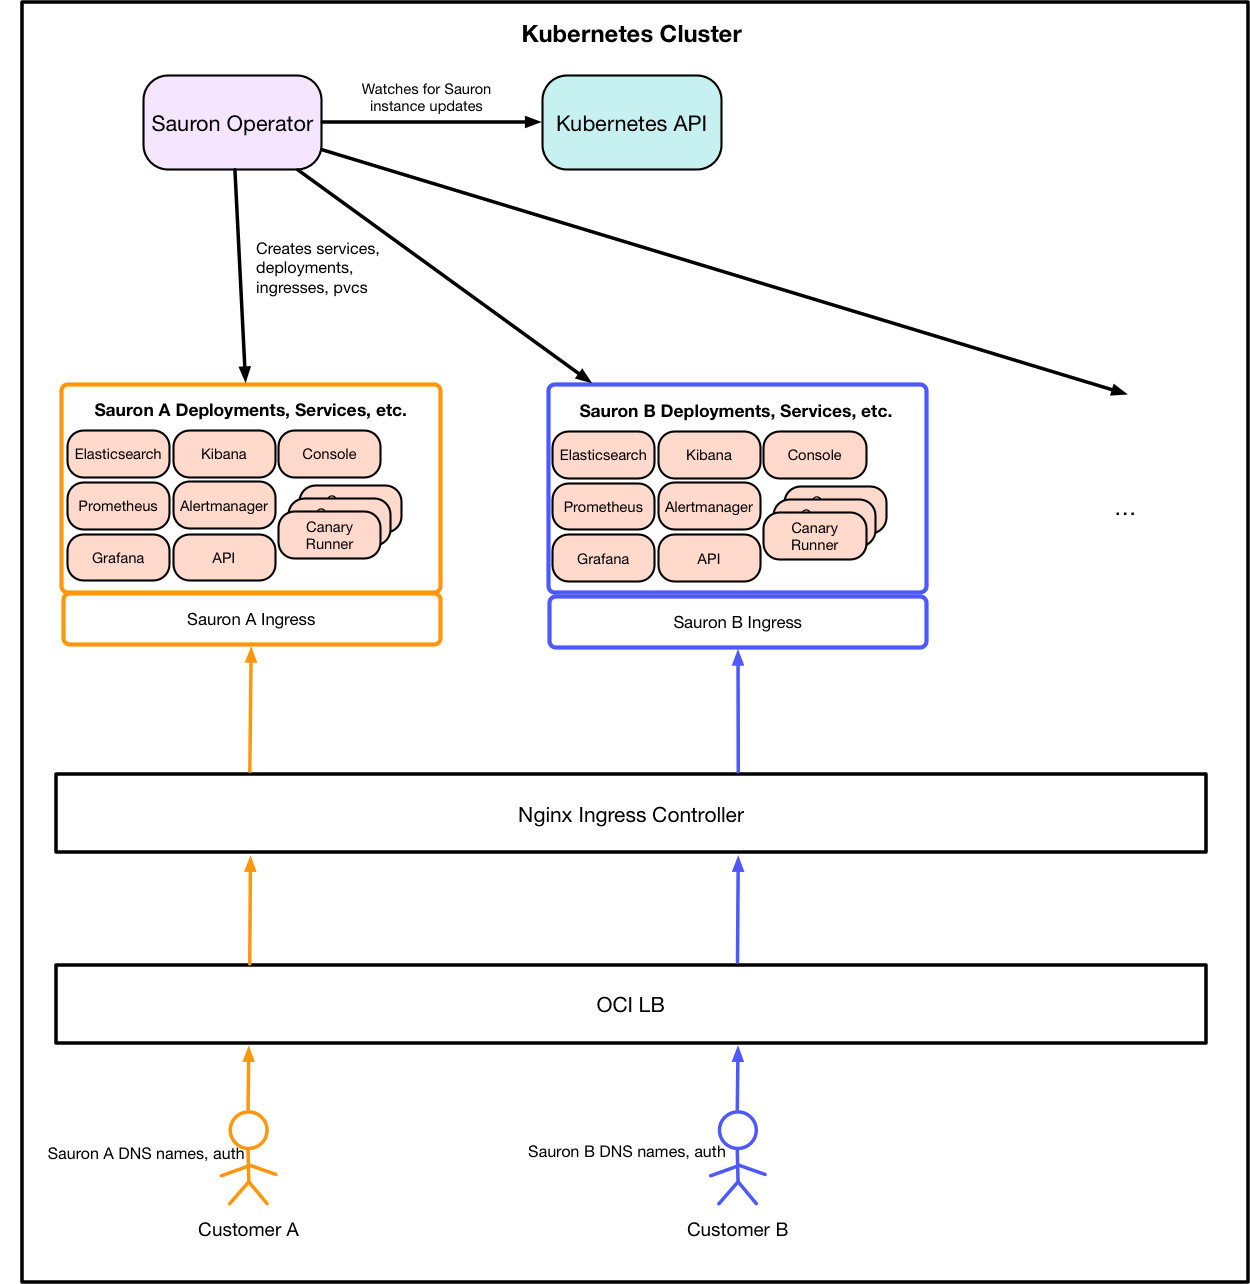
For each Sauron instance, Sauron creates its own deployments, services, storage, and ingress. Traffic from a browser or client reaches an endpoint through the load balancer, DNS, ingress, and then the backend pod for that component.
At a high level:
- An OCI load balancer fronts the ingress controller.
- DNS records route Sauron endpoint hostnames to that load balancer.
- The ingress for a Sauron instance defines the enabled frontend endpoints, certificates, and authentication behavior.
- Requests pass through the load balancer and ingress controller.
- The ingress routes requests to the backend pods for that Sauron's endpoints.
Network Architecture
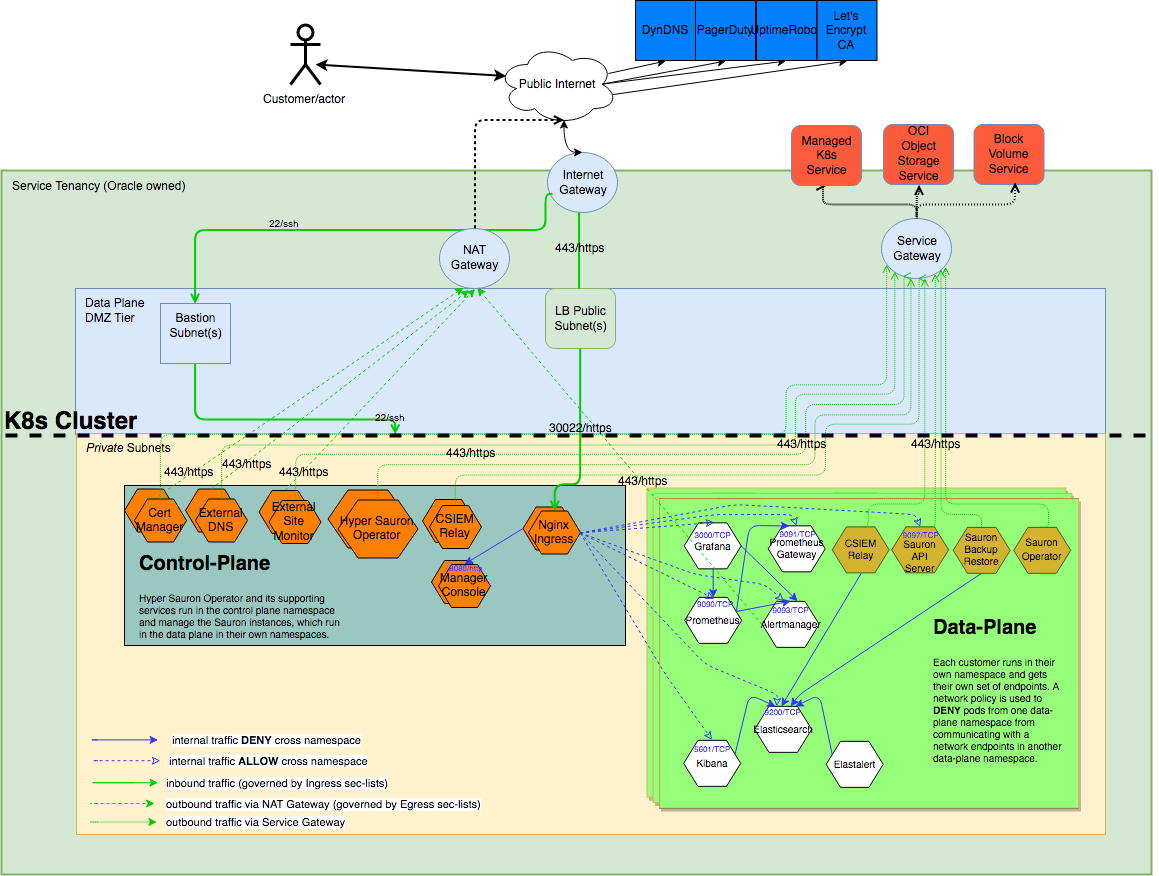
The network diagram shows how Sauron endpoint traffic enters the platform and reaches the Sauron components running in the Kubernetes cluster.
Metrics And Alert Flow
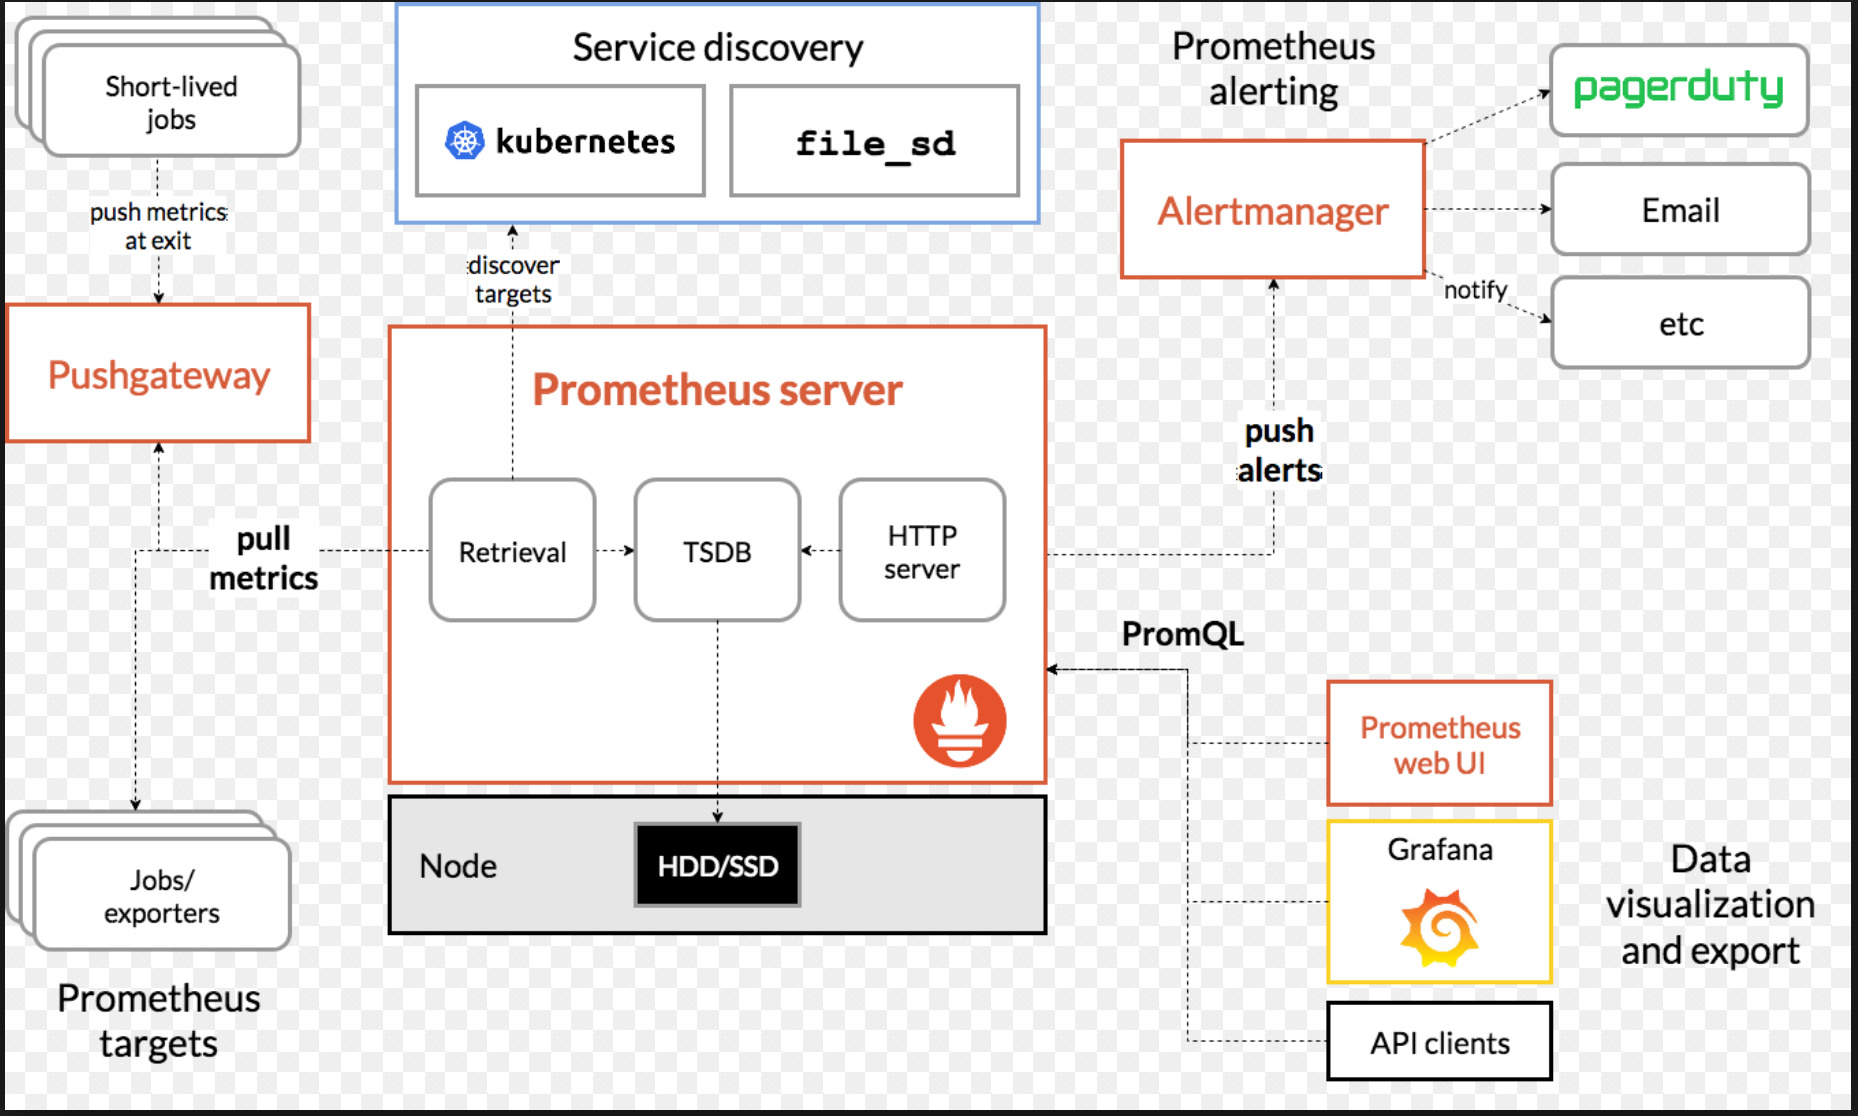
Sauron uses Prometheus for metrics collection, querying, and alert rule evaluation. Prometheus works with exporters, Alertmanager, Thanos, and Grafana.
Prometheus at a high level does the following:
- Scrapes metrics data from exporters and configured targets.
- Stores metrics data in its time-series database.
- Evaluates alert rules and sends firing alerts to Alertmanager.
- Returns metrics for clients such as Grafana and Thanos.
When alert conditions are satisfied, Prometheus sends alert notifications to Alertmanager. Alertmanager then routes those alerts to the configured receivers. Grafana and Thanos query metrics data for dashboards and analysis.
Operator View
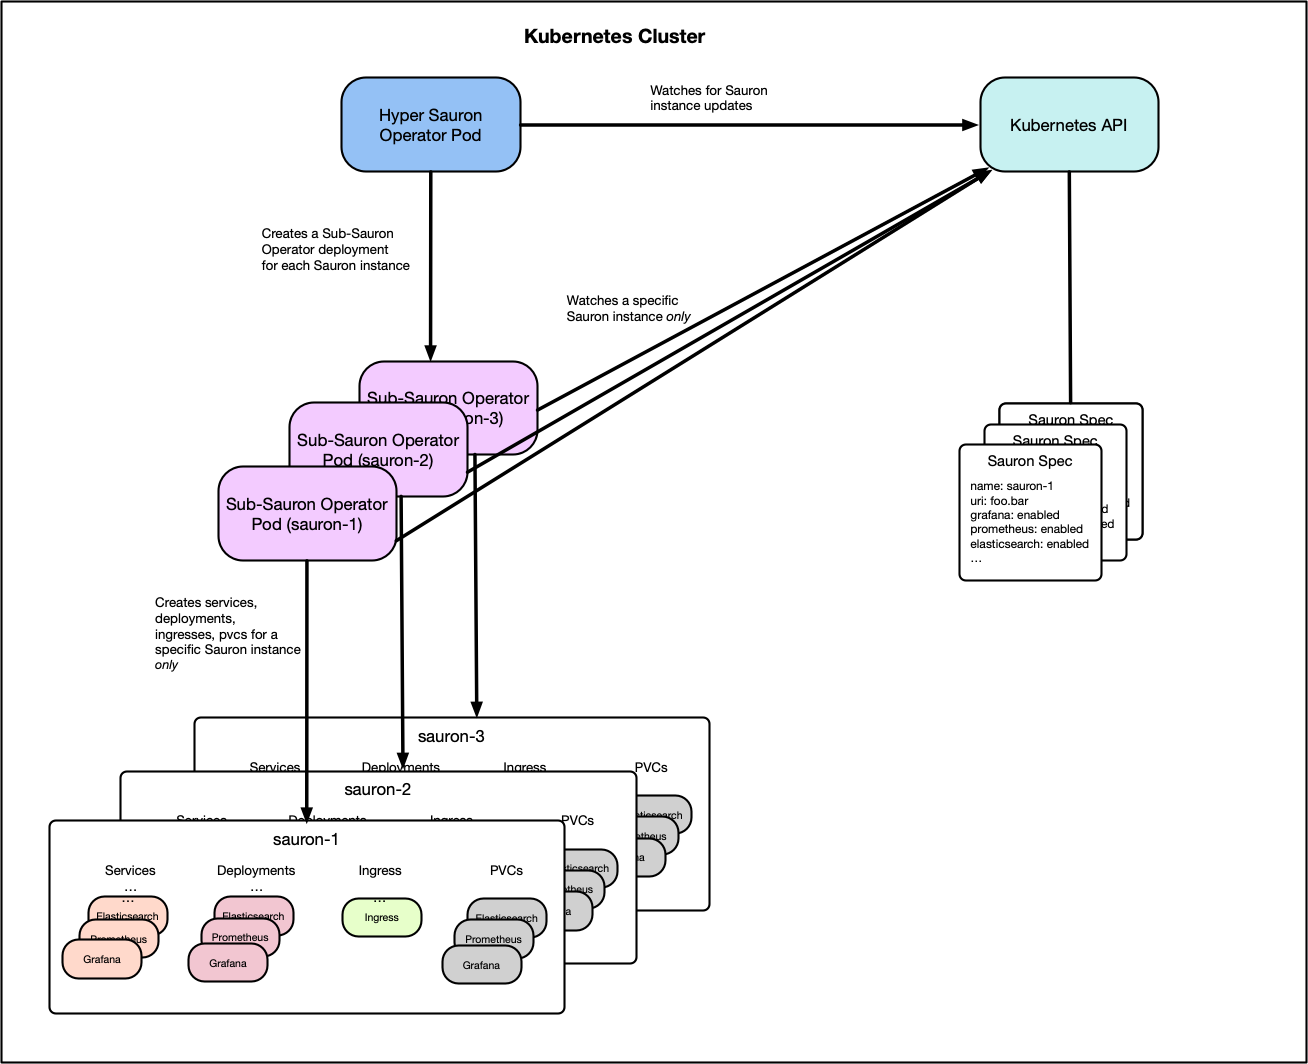
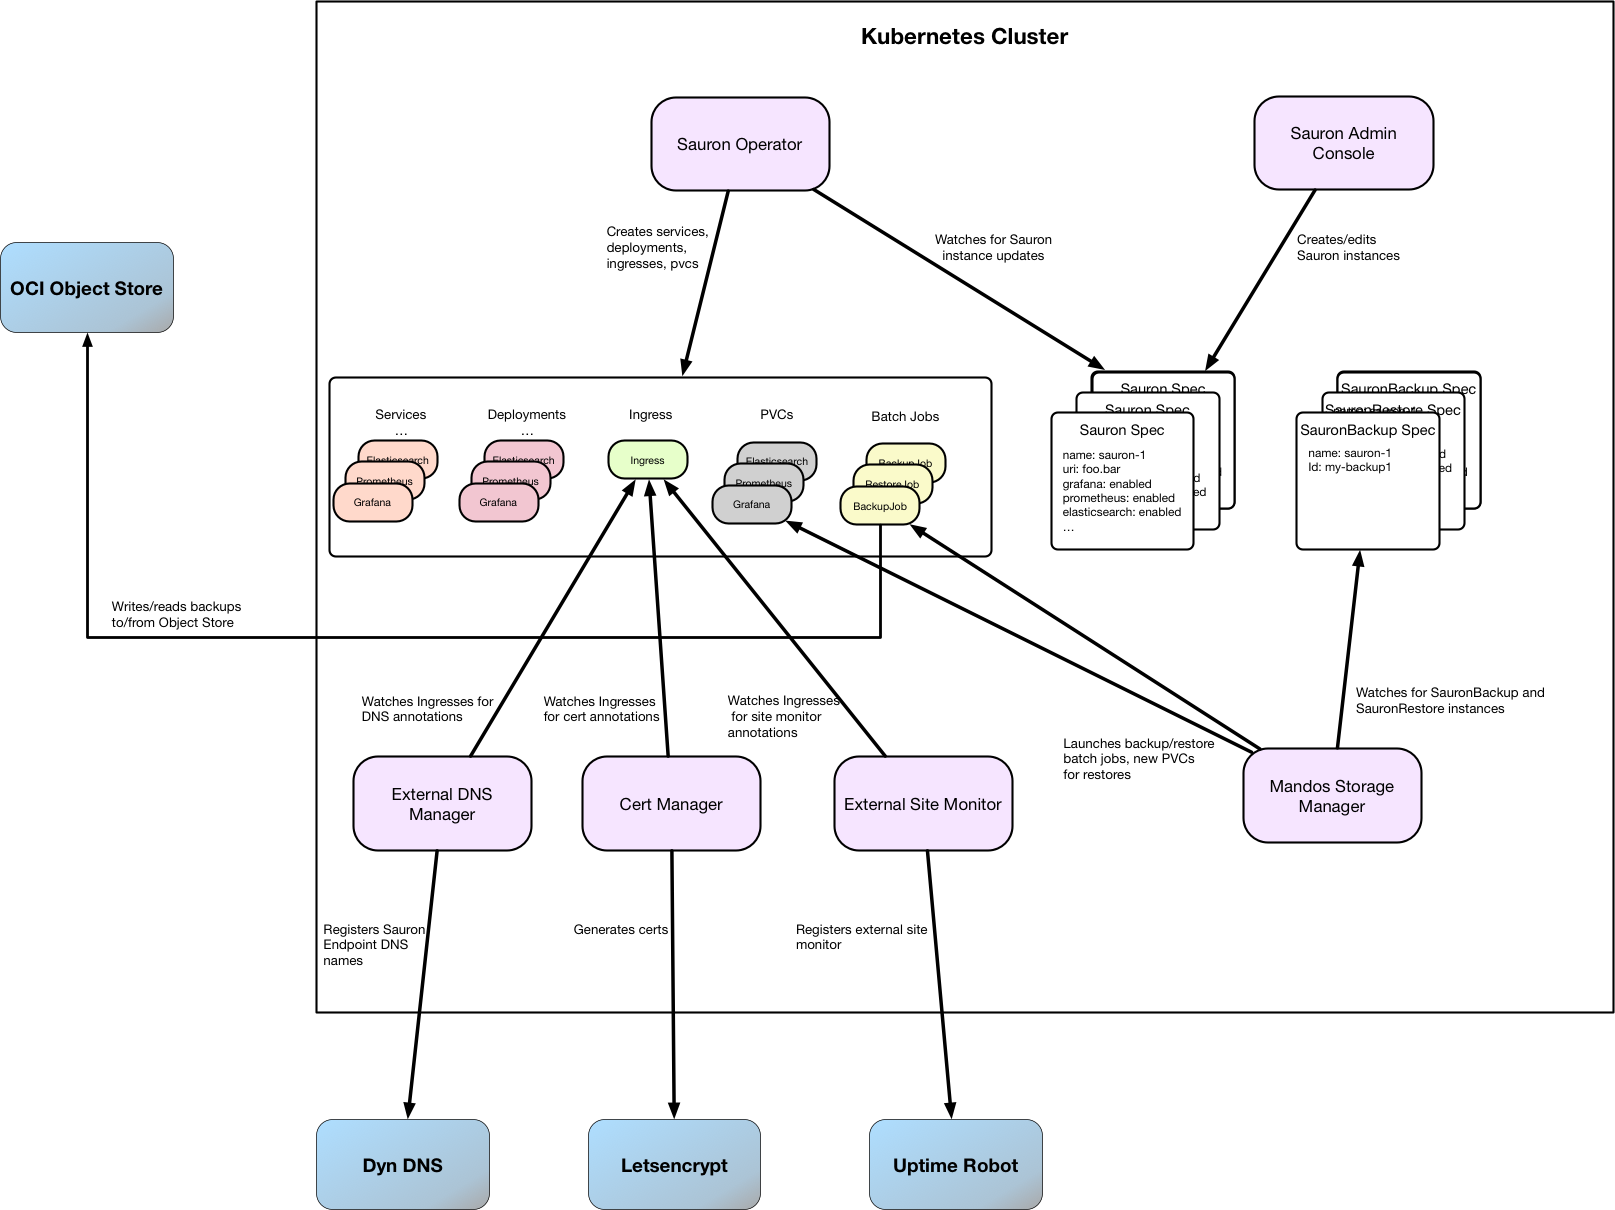
The Sauron Operator manages the Kubernetes resources for Sauron instances. It watches the Kubernetes API for Sauron resources and reconciles the deployments, services, persistent volume claims, and ingress needed for each instance.
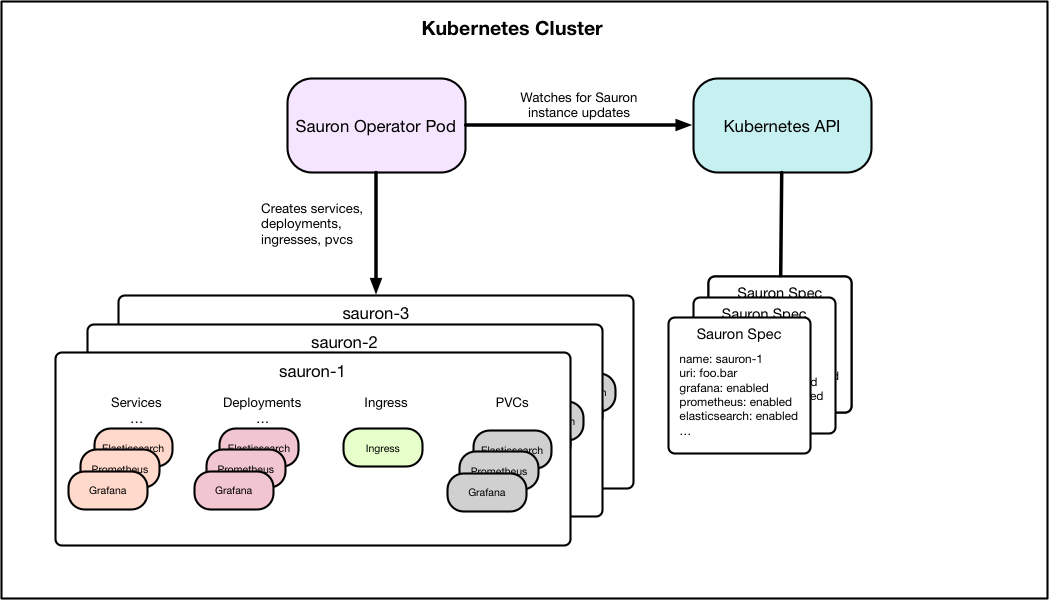
When the Sauron Operator runs in Hyper Operator Mode, it launches a Sub-Operator for each Sauron instance. Each Sub-Operator is a regular Sauron Operator running in Standard Mode, scoped to one Sauron instance.
Operator Ecosystem
The Sauron Operator works with other platform components that support Sauron instances:
- Operator-side admin console: used by cluster administrators to create and manage Sauron instances.
- Mandos Storage Manager: manages backup, restore, and data storage-related operations for Sauron instances.
- Cert Manager: handles automatic certificate generation.
- External DNS Manager: registers DNS entries.
- External Site Monitor: handles external site monitor registration.
Related Pages
- https://help.stage.apatil.developers.oracledx.com/user-access/
- https://help.stage.apatil.developers.oracledx.com/metrics/
- https://help.stage.apatil.developers.oracledx.com/logs/
- https://help.stage.apatil.developers.oracledx.com/alerts/
- https://help.stage.apatil.developers.oracledx.com/api-server/
- https://help.stage.apatil.developers.oracledx.com/console/
- https://help.stage.apatil.developers.oracledx.com/shuttleproxy/