OCI Metrics in Grafana
Use this page to configure Grafana to read Oracle Cloud Infrastructure metrics for your tenancy using the Oracle Cloud Infrastructure Metrics datasource.
The setup uses OCI API key configuration from your local OCI CLI profile, an OCI IAM group and policy that can read tenancy metrics, and a Grafana datasource configured with those values.
Before you start
Confirm these items before creating the datasource:
- You can access the target Grafana endpoint: https://grafana.stage.apatil.developers.oracledx.com.
- The OCI CLI is installed in your local environment.
oci setup confighas created$HOME/.oci/config.- Your OCI public key has been uploaded through OCI Console.
- The OCI user from your CLI config is in an OCI group that can read metrics and compartments.
- You can read the private key file referenced by your OCI config, such as
$HOME/.oci/oci_api_key.pem.
Do not paste OCI private keys, tokens, passwords, or full credentials into support channels, tickets, screenshots, or shared documents.
Create your first OCI metrics datasource
Configure OCI CLI
Install the Oracle Cloud Infrastructure CLI, then run:
oci setup config
If you have not uploaded your public key through OCI Console, follow the OCI API signing key instructions before continuing.
By default, oci setup config creates:
$HOME/.oci/config$HOME/.oci/oci_api_key.pem
Grafana needs values from the OCI config file and the private key file to configure the OCI Metrics datasource.
Configure OCI Identity group and policy
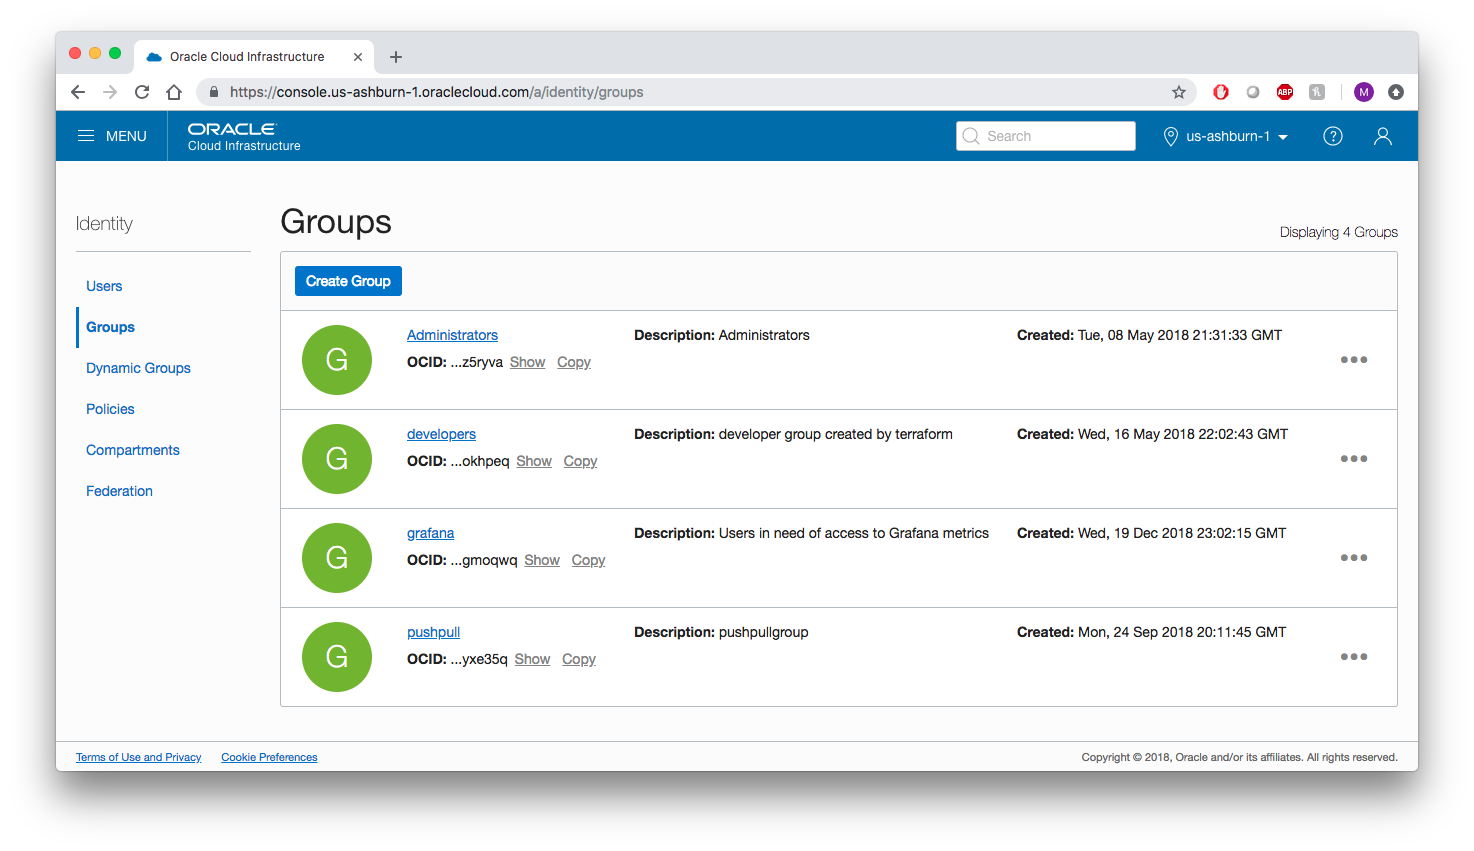
In OCI Console, create an OCI Identity group named grafana, then add the OCI user from your CLI config to that group.
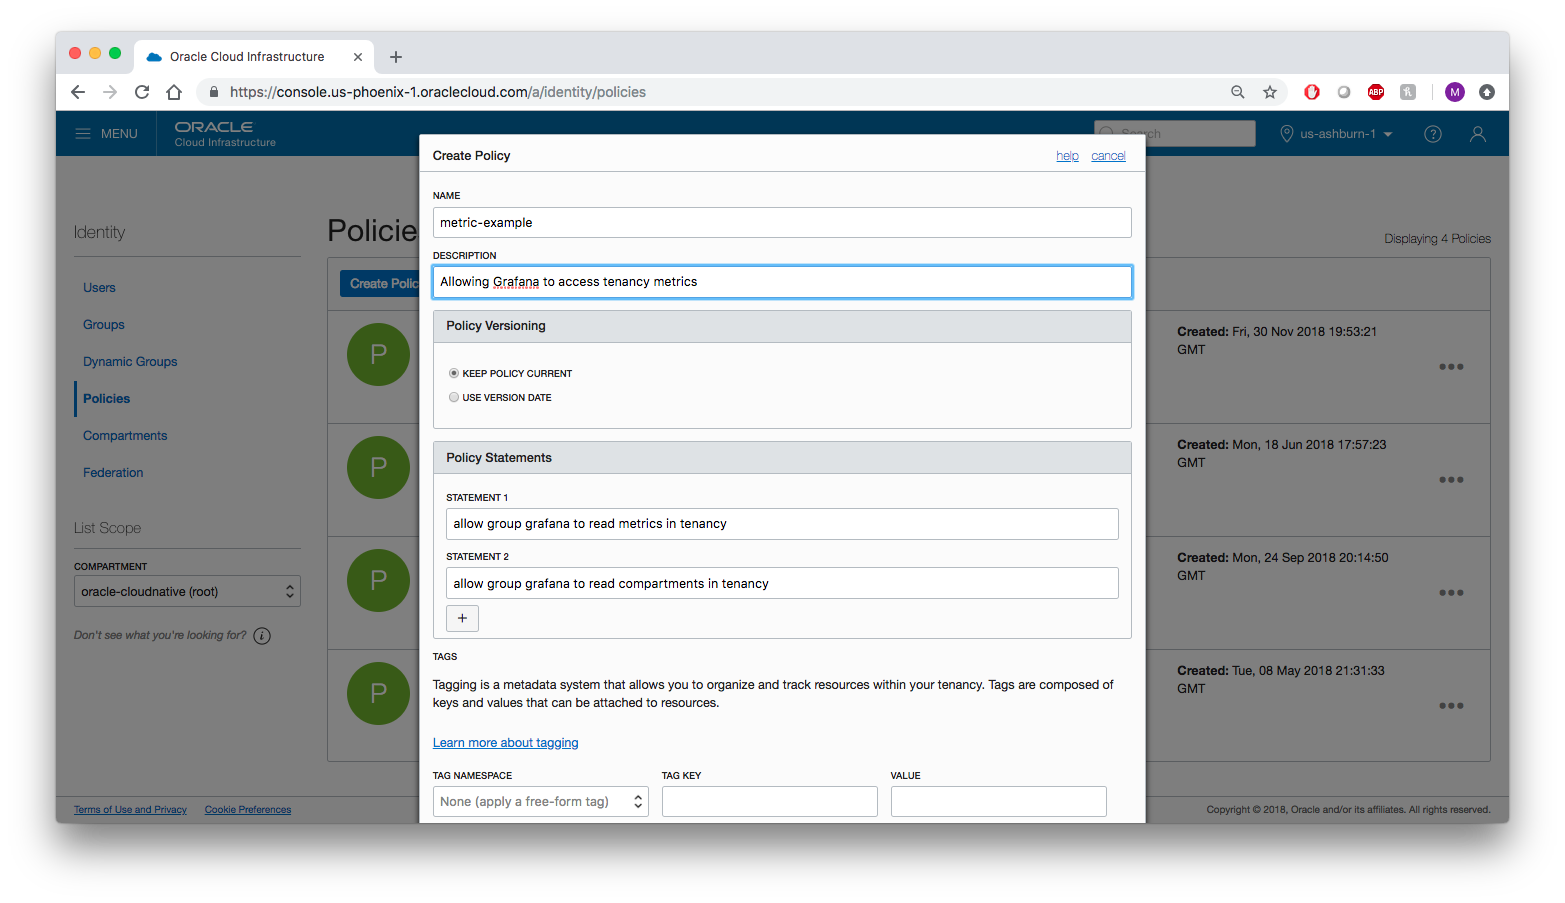
Create an OCI policy with these statements so the grafana group can read tenancy metrics and compartments:
allow group grafana to read metrics in tenancy
allow group grafana to read compartments in tenancy
Create the Grafana datasource
Open the Grafana datasource page:
https://grafana.stage.apatil.developers.oracledx.com/datasources/new
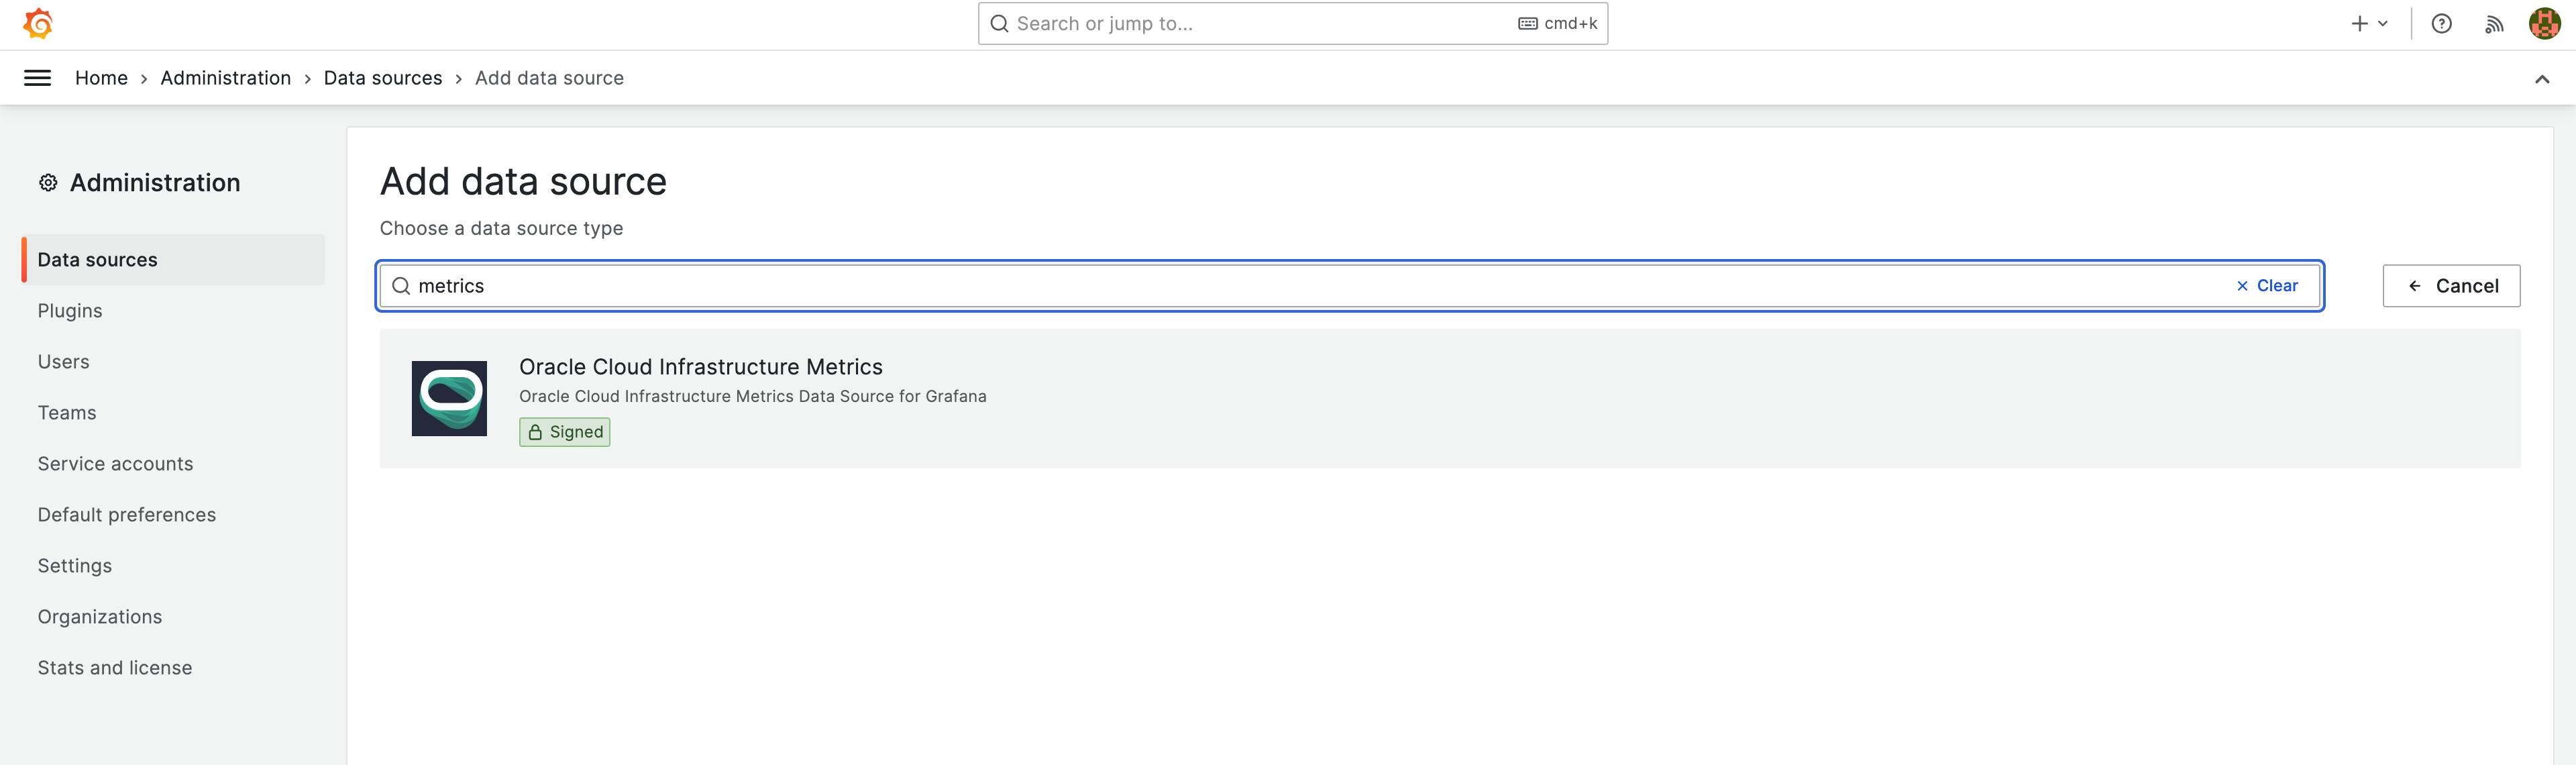
Select Add data source, search for Oracle, and choose Oracle Cloud Infrastructure Metrics.
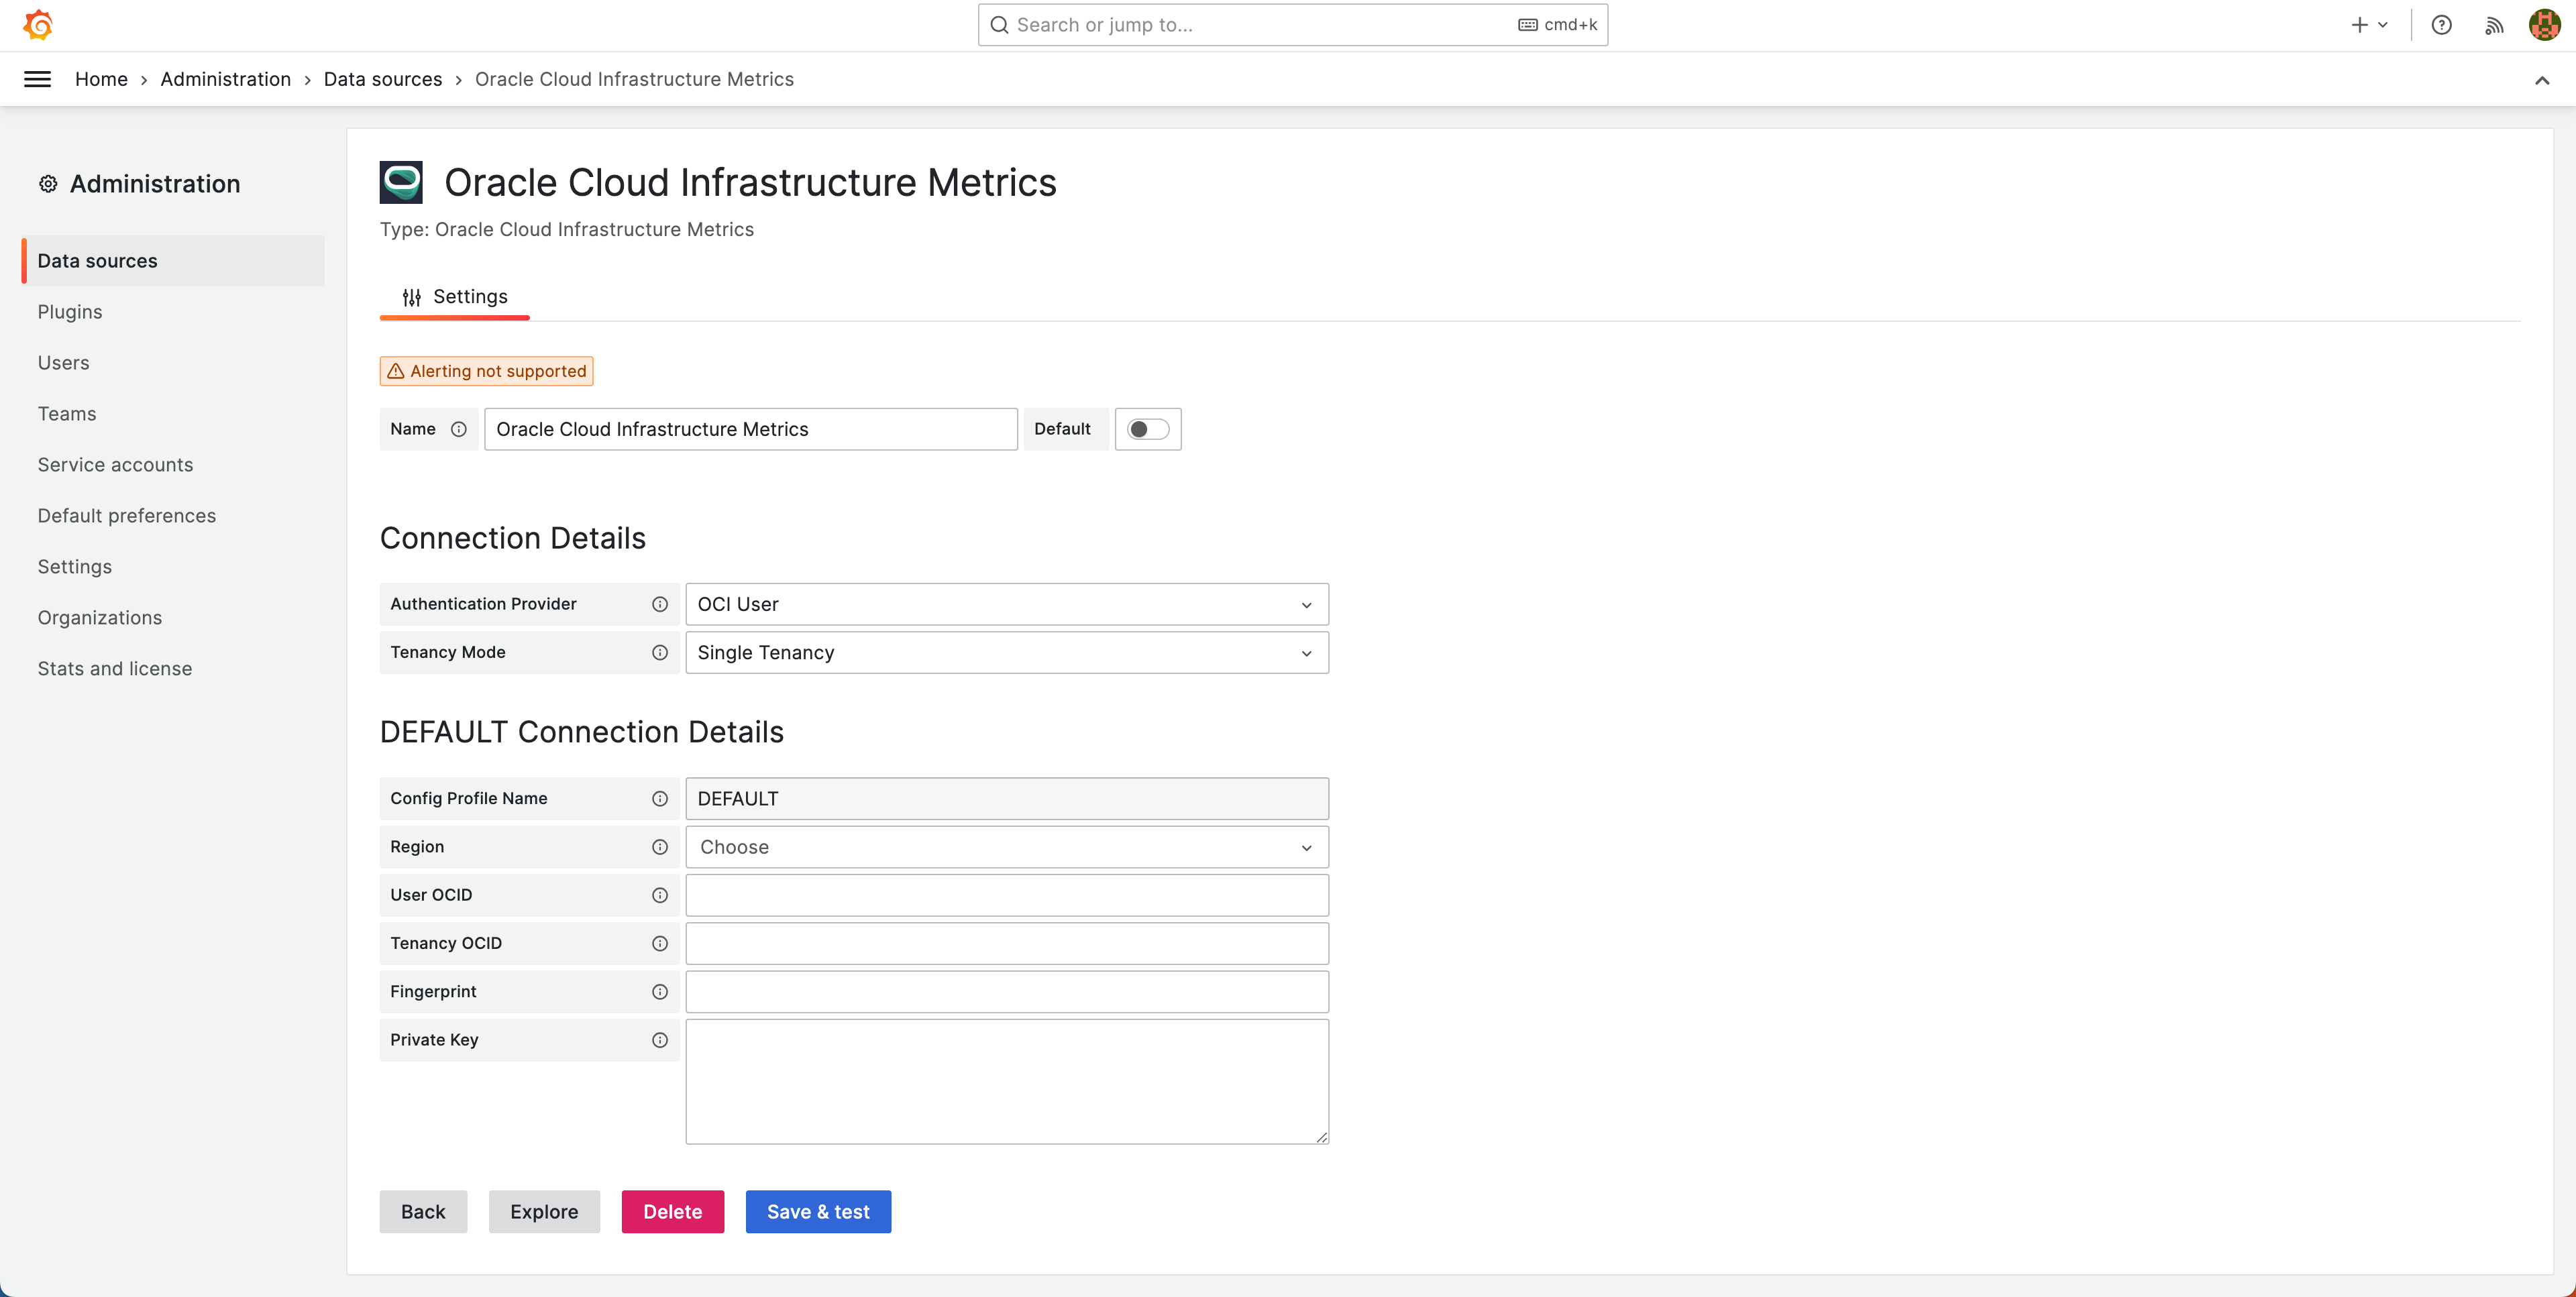
Configure the datasource with values from $HOME/.oci/config and $HOME/.oci/oci_api_key.pem:
- Set Authentication Provider to
OCI User. - Set Tenancy Mode to
Single Tenancy. - Choose the same region as the one in your OCI config file.
- Fill in User OCID, Tenancy OCID, and Fingerprint from
$HOME/.oci/config. - Fill in Private Key from your private key file.
- Click Save & Test.
For general usage of the OCI Metrics Plugin for Grafana, see the plugin usage documentation: https://github.com/oracle/oci-grafana-plugin/blob/master/docs/using.md.
For plugin version 4+ migration details, see: https://github.com/oracle/oci-grafana-metrics/blob/master/docs/migration.md.
Prove it works before production
Before relying on the datasource for dashboards:
- Confirm Save & Test succeeds in Grafana.
- Create or open a Grafana panel that uses the OCI Metrics datasource.
- Select the tenancy, compartment, namespace, and metric you expect to query.
- Confirm the panel returns data for the selected time range.
- If the datasource test or query fails, check the OCI region, User OCID, Tenancy OCID, fingerprint, private key, and OCI IAM policy.
Check Grafana logs
You can use the Sauron API Server to check Grafana pod logs when datasource setup fails:
- Open https://api.stage.apatil.developers.oracledx.com.
- Search for
Logs. - Open
GET /v1/log. - Select
grafanaaspodNamePrefix. - Click Execute.
Remove private keys, tokens, passwords, and full credentials before sharing any log output.
Self-check before escalation
Before contacting Sauron support, collect this information:
- Sauron URL.
- Grafana datasource name.
- OCI region selected in the datasource.
- Authentication provider and tenancy mode selected.
- Whether Save & Test succeeds.
- Exact Grafana error or API log error, with secrets removed.
- Whether the OCI user is in the
grafanagroup. - Whether the OCI policy includes read access to metrics and compartments.
- Whether the same OCI config works with the OCI CLI.
- Dashboard or panel URL, if a specific panel fails.
- Time range and metric namespace tested.
- Recent OCI key, policy, group, region, or datasource changes.
- Impact, including whether this affects all OCI metrics panels or only one query.
Do not share OCI private keys, tokens, passwords, or full credentials in support channels.